- February 28, 2024
- Posted by: capadmin
- Category: Market News
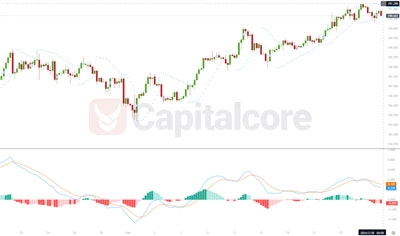
Sustained Uptrend for GBPJPY Revealed by Parabolic SAR, While MACD Hints at Momentum Shift
In the provided chart of GBPJPY, the Parabolic SAR (Stop and Reverse) is indicating a consistent uptrend as the dots are placed below the price bars. This trend-following indicator suggests that the uptrend is strong and has remained unchallenged for the visible period on the chart. The uninterrupted position of the dots below the price action is a strong bullish signal, typically prompting traders to consider maintaining or initiating long positions until a reversal is indicated by the dots switching above the price bars.
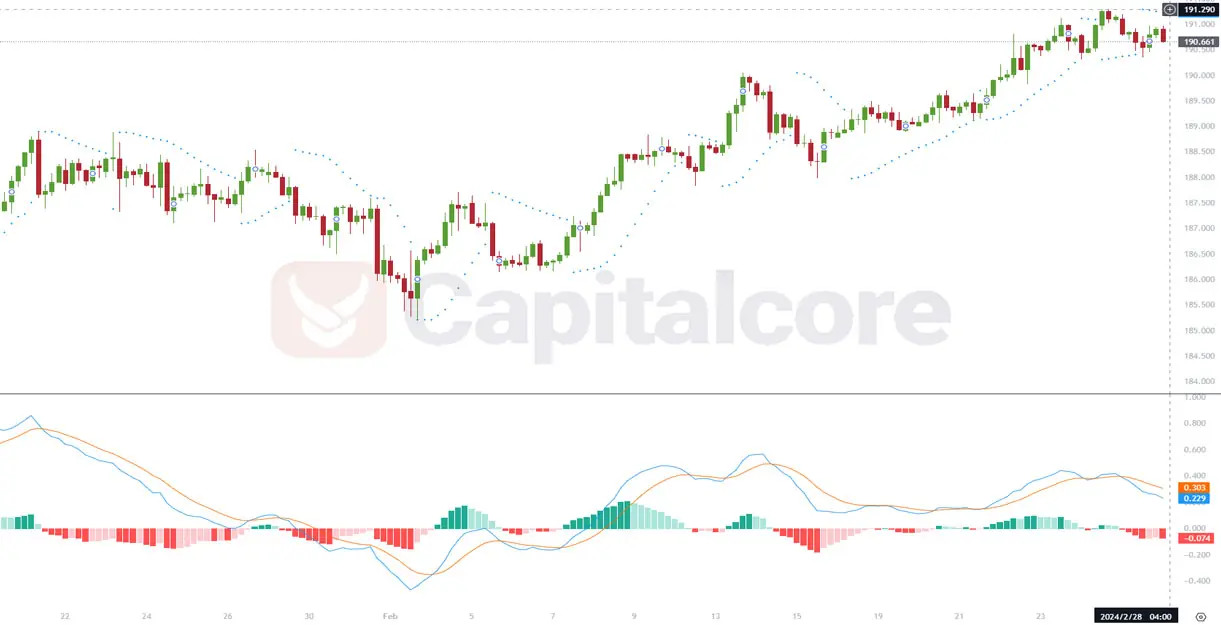
Chart Notes:
• Chart time-zone is UTC (+03:00)
• Candles’ time-frame is 4h.
The MACD (Moving Average Convergence Divergence), on the other hand, offers a more nuanced view. While the MACD line (blue) is above the signal line (orange), indicating bullish momentum, the histogram seems to be decreasing in positive value, suggesting a potential slowdown in the bullish momentum. This could imply that while the trend is still upwards, buyers may be losing some strength, and caution is warranted. A crossover of the MACD line below the signal line would be a bearish signal, which would warrant attention for a possible change in trend or a retracement.
It’s important to combine these signals with additional analysis and to consider economic factors, market sentiment, and other technical indicators for a comprehensive trading strategy. The analysis of the GBPJPY pair would also benefit from an understanding of the broader market sentiment and economic announcements affecting both the British Pound and the Japanese Yen.
• DISCLAIMER: Please note that the above analysis is not an investment suggestion by “Capitalcore Ltd”. This post has been published only for educational purposes.