- December 27, 2023
- Posted by: capadmin
- Category: Market News
“GBPJPY Momentum Assessment: Neutral RSI and Emerging Bullish MACD on the T4 Timeframe”
The GBPJPY pair on the 4-hour chart is showing a potential shift in momentum. The moving average (MA) is positioned below the candlesticks, which typically suggests that the trend has been bearish but may be shifting. The price is currently above the MA, indicating a potential reversal or pullback from the recent downtrend. This setup could attract buyers who are looking for a trend change or a bounce from a support level
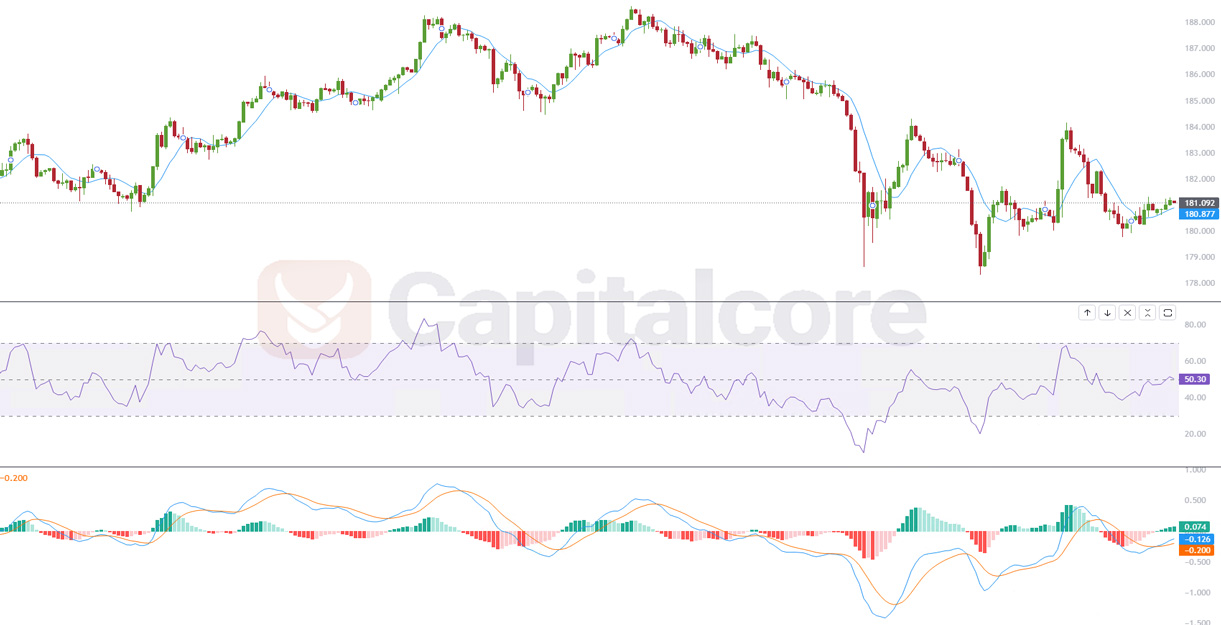
Chart Notes:
• Chart time-zone is UTC (+03:00)
• Candles’ time-frame is 4h.
The Relative Strength Index (RSI) stands at 50.48, straddling the midpoint, which reflects a balance between buying and selling pressures. A neutral RSI like this often indicates that the market is neither overbought nor oversold, and the currency pair could be in a state of consolidation or indecision. The MACD indicators are green, with both the signal line and the MACD line below the histogram. This positioning of the MACD suggests that while there is a presence of bullish momentum, as evidenced by the green bars, the market sentiment has not yet established a strong bullish trend since the lines are below the histogram, which can sometimes signal a weakening upward movement. Traders might wait for further confirmation of trend strength before taking significant positions.
• DISCLAIMER: Please note that the above analysis is not an investment suggestion by “Capitalcore Ltd”. This post has been published only for educational purposes.