- November 1, 2023
- Posted by: capadmin
- Category: Market News
GBP/USD Faces Technical Headwinds
The GBP/USD pair demonstrates notable bearish tendencies in its recent technical configurations. The Moving Average (MA) is trending downward, converging with the price candles, signaling potential continued bearish momentum. In the MACD indicator, the presence of a red histogram underscores this bearish sentiment
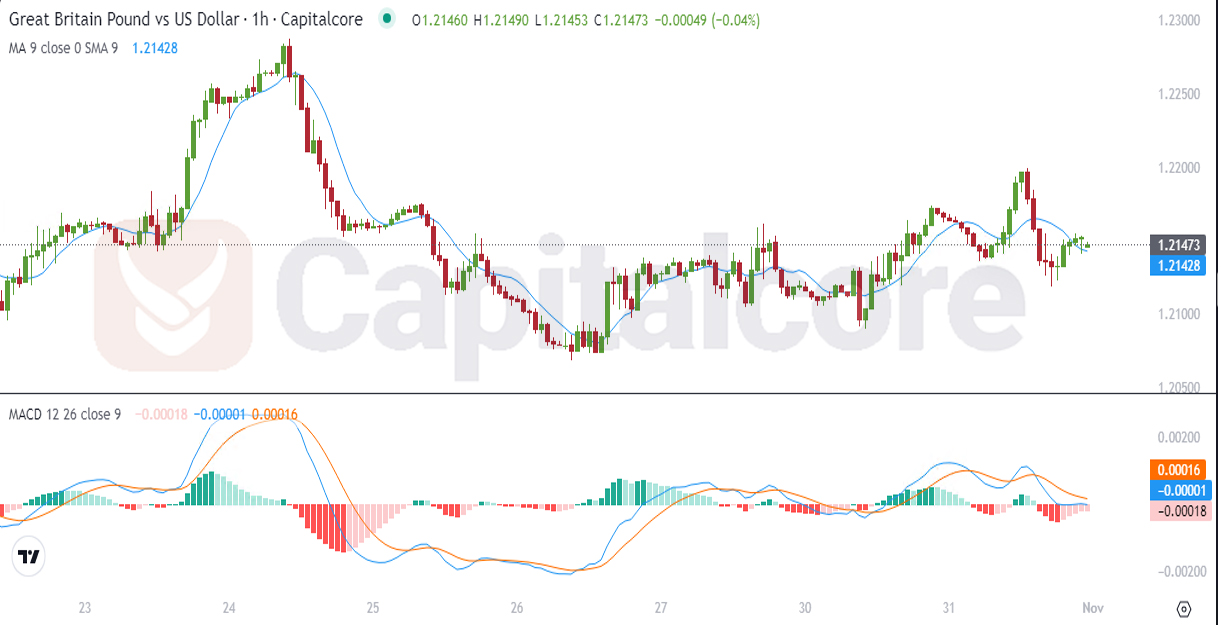
Chart Notes:
• Chart time-zone is UTC (+03:00)
• Candles’ time-frame is 4h.
Furthermore, the MACD line aligning closely with the histogram bars suggests a strong and sustained momentum in the current direction. The position of the signal line above the MACD line typically indicates a bearish crossover, reinforcing the potential for further downside movement for the GBP/USD pair. Collectively, these indicators suggest traders should tread with caution and potentially anticipate a continued bearish trend.
• DISCLAIMER: Please note that the above analysis is not an investment suggestion by “Capitalcore Ltd”. This post has been published only for educational purposes.