- December 18, 2023
- Posted by: capadmin
- Category: Market News
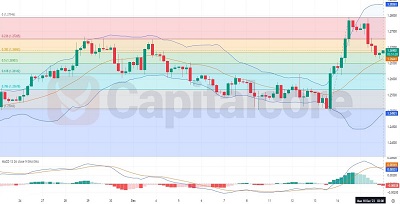
H4 Chart: GBPUSD Momentum Deceleration
The GBPUSD pair, commonly known as the “Cable,” exhibits dynamic fluctuations on the 4-hour chart, offering insights into the short-term sentiment and potential trading opportunities. Technical indicators provide a layered perspective of market momentum and price trends, critical for forecasting future movements.

Chart Notes:
• Chart time-zone is UTC (+03:00)
• Candles’ time-frame is 4h.
On the H4 timeframe, GBPUSD has shown a vigorous uptrend, as indicated by the sharp rise above the exponential moving averages (EMA). The Fibonacci retracement levels drawn from the recent swing low to high point to potential support zones, with the price currently testing the 0.236 level. If this level fails to hold, the next areas of interest are the 0.382 and 0.5 levels at 1.2663 and 1.2650 respectively. The Bollinger Bands have expanded significantly, reflecting the surge in volatility with the price retracing from the upper band. The MACD histogram reveals decreasing bullish momentum as the bars decline in height, suggesting a potential slowdown in the upward movement. Volume analysis shows an increase accompanying the latest bullish candle, reinforcing the strength of the upward price action, albeit traders should remain cautious of a possible retracement as the price approaches significant Fibonacci levels.
• DISCLAIMER: Please note that the above analysis is not an investment suggestion by “Capitalcore Ltd”. This post has been published only for educational purposes.