- December 29, 2023
- Posted by: capadmin
- Category: Market News
Cable’s Retracement: An H4 Technical Perspective
The GBPUSD, often termed ‘Cable’, is a key forex pair reflecting the economic dynamics between the United Kingdom and the United States. In this analysis, we’ll scrutinize the H4 chart, taking into account the Bollinger Bands and MACD indicators, to deduce the pair’s potential market trajectory.
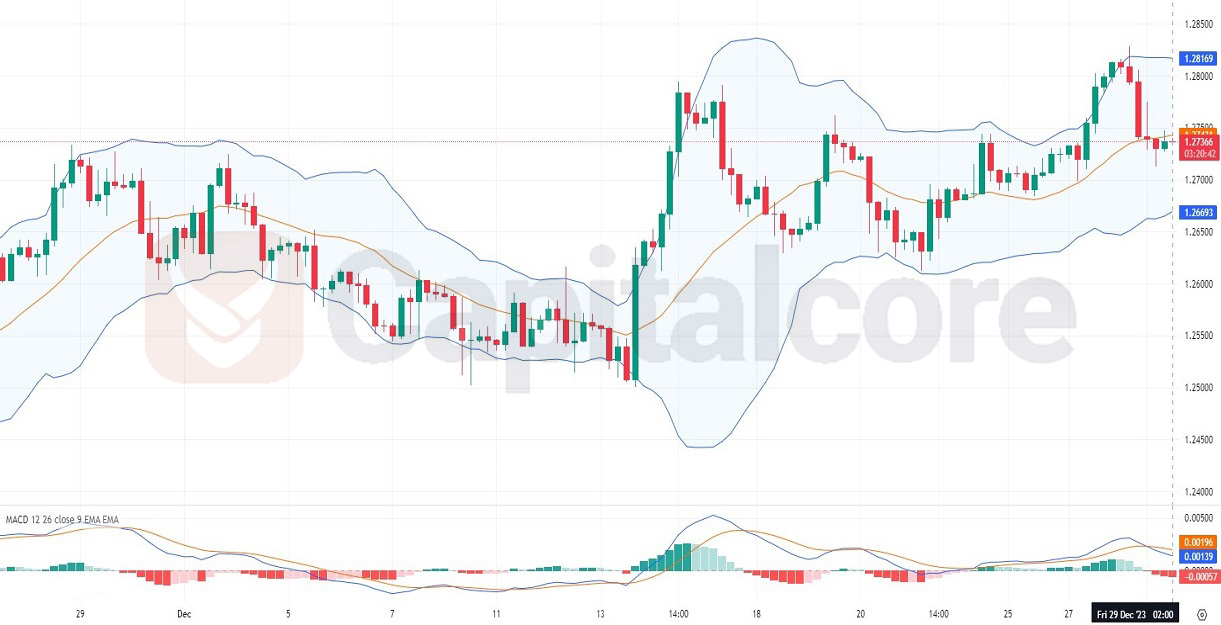
Chart Notes:
• Chart time-zone is UTC (+03:00)
• Candles’ time-frame is 4h.
On the H4 chart, GBPUSD has shown volatility within the confines of the Bollinger Bands, recently touching the upper band before retracting, indicating a possible overextension in the short term. The MACD reveals a bullish crossover has occurred, with the MACD line crossing above the signal line, yet the negative histogram suggests a loss in upward momentum. The retracement towards the mean, suggested by the Bollinger Bands, alongside the weakening MACD, may signal a potential short-term pullback or consolidation phase for Cable, as traders may seek to capitalize on the recent price peak.
• DISCLAIMER: Please note that the above analysis is not an investment suggestion by “Capitalcore Ltd”. This post has been published only for educational purposes.