- January 4, 2024
- Posted by: capadmin
- Category: Market News
MACD Histogram Nears Bullish Crossover Point
Our latest technical analysis of the GBP/USD pair on the H4 chart reveals a potentially bullish setup. The Parabolic SAR indicator has positioned its last three dots below the price candles, a signal that often heralds a shift towards an upward trend. This movement suggests that the market may be on the cusp of a trend reversal, inviting traders to consider the implications for their trading strategies.
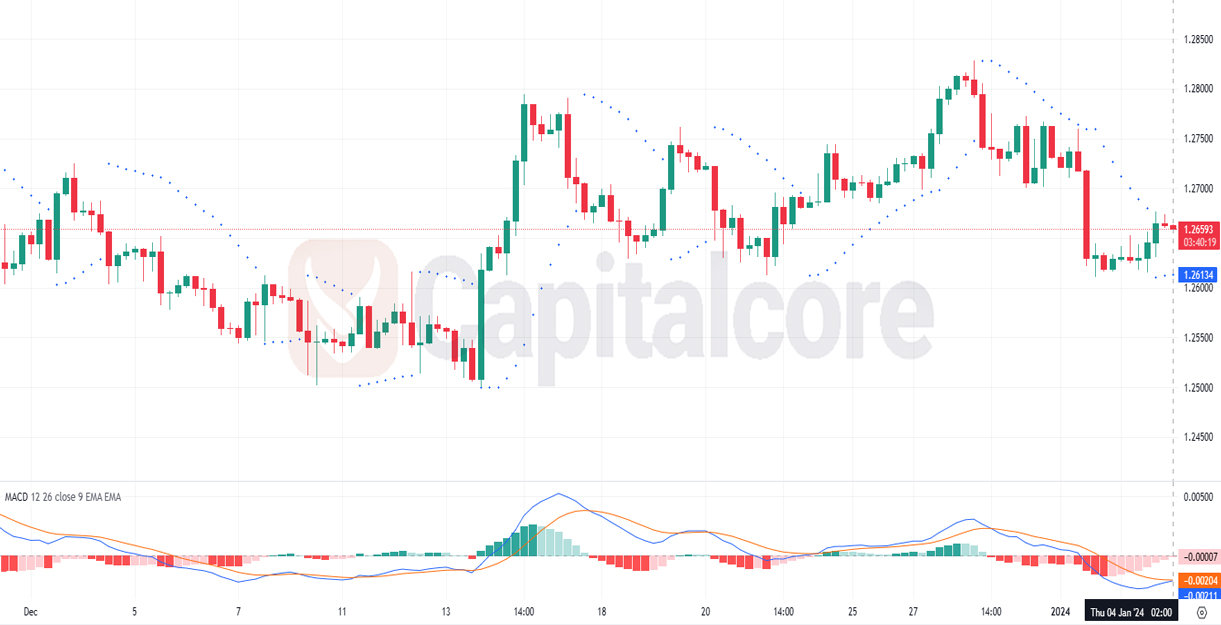
Chart Notes:
• Chart time-zone is UTC (+03:00)
• Candles’ time-frame is 4h.
The chart’s Parabolic SAR indicator now underlines the candlesticks, hinting at a bullish sentiment. This typically encourages a positive outlook, where traders might look to initiate long positions, with the SAR providing dynamic support levels that can also serve as trailing stops for trade management. However, the Moving Average Convergence Divergence (MACD) presents a more complex picture. Despite the bearish overtone suggested by the MACD line’s position below the signal line and the histogram’s negative territory, there is an apparent convergence of the MACD line towards the signal line. This suggests a diminishing bearish momentum, potentially foreshadowing a bullish crossover if the trend persists. The histogram, with its bars inching closer to the zero line, corroborates this weakening bearish momentum. For astute traders, this mixed signal landscape calls for a cautious approach—waiting for the MACD line to convincingly cross above the signal line could serve as a confirmation of the bullish momentum implied by the SAR. As the market unfolds, aligning these indicators with a robust confirmation strategy will be crucial for traders to navigate the GBP/USD currency pair with greater confidence.
• DISCLAIMER: Please note that the above analysis is not an investment suggestion by “Capitalcore Ltd”. This post has been published only for educational purposes.