- May 31, 2024
- Posted by: james w
- Category: Market News
Cable’s Technical Outlook with Bollinger Bands and MACD
The GBPUSD currency pair, also known as Cable, represents the exchange rate between the British Pound and the US Dollar. It is one of the most traded pairs in the forex market, reflecting the economic and political relationship between the United Kingdom and the United States. Today, the GBP USD pair is influenced by several upcoming economic reports. In the UK, the Nationwide HPI m/m, M4 Money Supply m/m, Mortgage Approvals, and Net Lending to Individuals are expected to have low impacts. These reports can indicate housing market trends, money supply changes, and lending conditions, which collectively give insights into the UK’s economic health. On the US side, the Core PCE Price Index m/m, a high-impact report, is crucial as it reflects the Federal Reserve’s primary inflation measure, potentially affecting their interest rate decisions. Additionally, low-impact reports like Personal Income m/m, Personal Spending m/m, and the Chicago PMI will also be released, providing further insights into the economic activity and consumer behavior in the US.

Chart Notes:
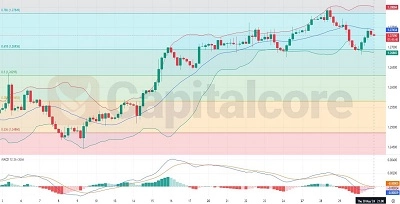
• Chart time-zone is UTC (+03:00)
• Candles’ time-frame is 4h.
Analyzing the H4 chart of GBP/USD, the recent price action shows a mixed momentum. The GBPUSD’s last five candles have moved from the lower band towards the middle band of the Bollinger Bands, with three bullish candles followed by two bearish candles. The Cable’s recent candles have touched the middle band, indicating potential resistance at this level. The Bollinger Bands have widened slightly, suggesting increased volatility. The GBP-USD’s MACD indicator shows a weakening bullish momentum, with the MACD line close to crossing below the signal line. These indicators collectively suggest that while there is some bullish pressure, the overall trend may face resistance and potential bearish movements near the middle band.