- October 26, 2023
- Posted by: capadmin
- Category: Market News
Deciphering Momentum through Bollinger Bands and Stochastic RSI
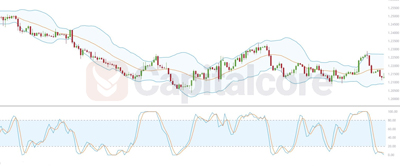
Our most recent dive into the GBPUSD landscape leverages the insights from the Bollinger Bands coupled with the Stochastic RSI, offering a comprehensive view of the pair’s trajectory.

Chart Notes:
• Chart time-zone is UTC (+03:00)
• Candles’ time-frame is 4h.
The GBPUSD chart visibly oscillates within the Bollinger Bands’ confines. Earlier, we noticed a decisive bearish movement with prices nudging the lower band, a testament to strong sell-offs. However, a shift appears as prices rebound towards the middle band, hinting at a possible consolidation or reversal. Concurrently, the Stochastic RSI exhibits intriguing behavior. After lingering in the oversold territory, there’s a perceptible upward curl, suggesting a potential bullish momentum. Combining these tools, traders should exercise caution and await further confirmatory signals for robust decision-making.
• DISCLAIMER: Please note that the above analysis is not an investment suggestion by “Capitalcore Ltd”. This post has been published only for educational purposes.