- December 19, 2023
- Posted by: capadmin
- Category: Market News
Gold Technical Analysis
The H4 chart for Gold presents an intricate view of the current market conditions, incorporating the use of the Ichimoku Cloud, Moving Average Convergence Divergence (MACD), and the Relative Strength Index (RSI). These technical indicators are essential for traders to discern short-term price momentum and potential entry or exit points.
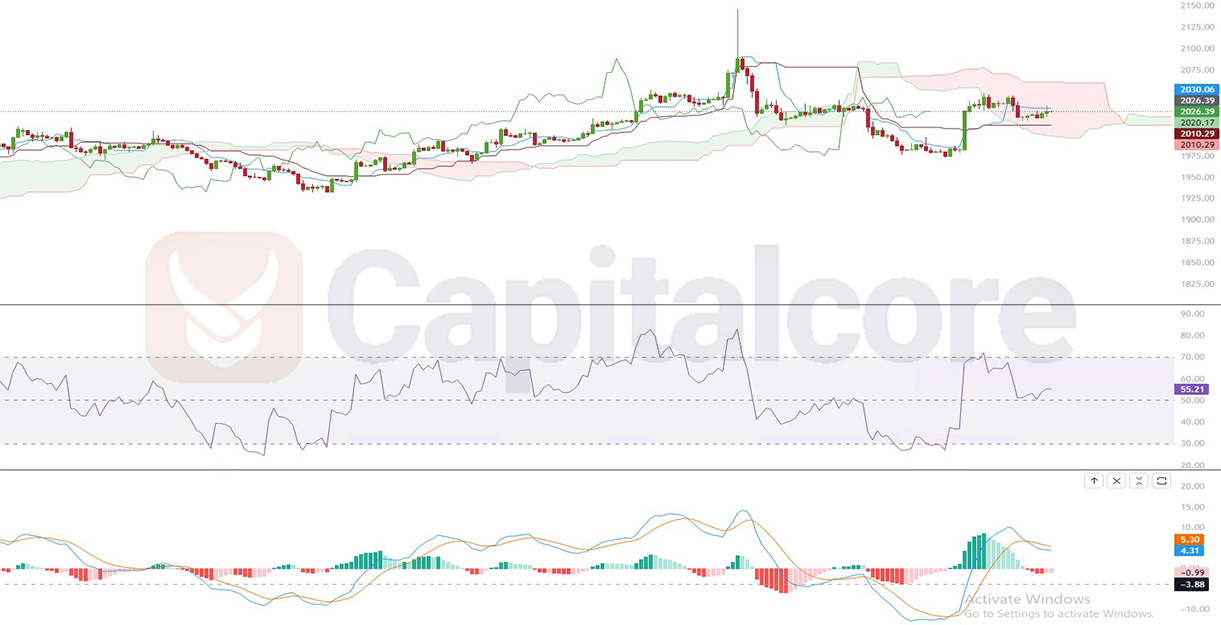
Chart Notes:
• Chart time-zone is UTC (+03:00)
• Candles’ time-frame is 4h.
Analyzing the chart, Gold is currently traversing within the Ichimoku Cloud, indicating a zone of equilibrium where buyers and sellers are in contention, and a trend is not clearly defined. The proximity of the price to the lower boundary of the cloud may suggest a potential breakout to the downside. Traders often look for a clear price movement outside of the cloud for confirmation of a trend.
The MACD indicator, located at the bottom of the chart, shows the MACD line (blue) and the signal line (orange) converging, which implies a weakening momentum. The histogram reflects this as well, with the bars shortening in height and shifting from green to red, indicating a potential change in the trend from bullish to bearish.
Above the MACD, the RSI is hovering around the 55.21 level, which is neither in the overbought nor oversold territory. This suggests that there is room for the price to move either way without immediate pressure from over-extension.
• DISCLAIMER: Please note that the above analysis is not an investment suggestion by “Capitalcore Ltd”. This post has been published only for educational purposes.