- January 24, 2024
- Posted by: capadmin
- Category: Market News
Gold’s Glimmer on the 4-Hour Chart: A Potential Uptrend in the Making
The SPOT Gold against the US Dollar, as visualized on the 4-hour chart, displays an ambivalent market with a propensity for rising strength. The precious metal, typically seen as a haven during market turbulence, is fluctuating within the Bollinger Bands, with the price recently rebounding from the lower band and crossing above the midline, indicating potential bullish momentum. The zigzag indicator, though not visible on the provided chart, would likely show a pattern of higher lows if present, further substantiating the resilience of gold in the given timeframe.
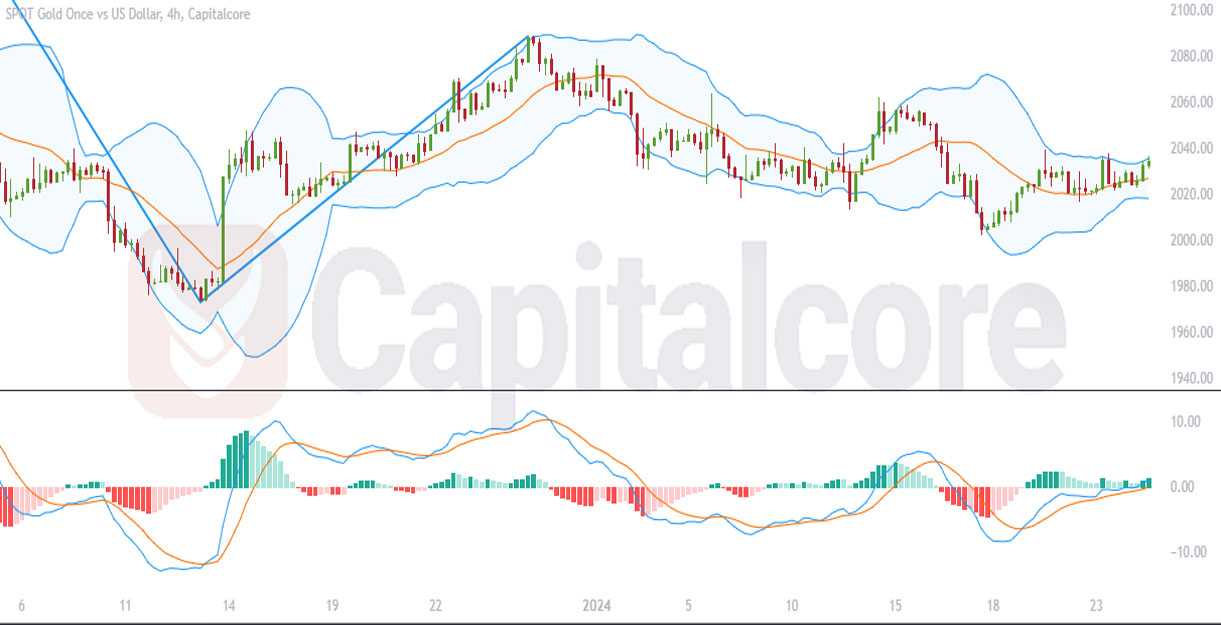
Chart Notes:
• Chart time-zone is UTC (+03:00)
• Candles’ time-frame is 4h.
Technical indicators offer a mixed sentiment, yet with a bullish inclination. The MACD, situated below the price chart, reveals that the MACD line has recently crossed above the signal line, with histogram bars turning green and growing in height, suggesting a strengthening bullish momentum. This crossover is a classical bullish signal, often prompting traders to anticipate further upward price action.
The Bollinger Bands themselves are moderately spaced, suggesting a stable level of volatility. The price’s interaction with the midline and the recent push towards the upper band could tempt bulls to aim for a continuation of the upward move.
In summary, the technical analysis for Gold on the H4 chart presents a cautiously optimistic outlook, with recent price action and the MACD indicating a shift towards bullish conditions. While the market retains its fickleness, indicated by the recent swings within the bands, there’s an evident lean towards upward potential. As always, traders should maintain a vigilant watch on global economic indicators and market sentiment, as gold is particularly sensitive to such factors. Prudent risk management remains essential, especially in light of gold’s historical volatility and its role as a global economic barometer.
• DISCLAIMER: Please note that the above analysis is not an investment suggestion by “Capitalcore Ltd”. This post has been published only for educational purposes.