- January 30, 2024
- Posted by: capadmin
- Category: Market News
“Interpreting Gold’s Direction: Technical Indicators Ichimoku, MACD, and RSI Offer Clues on the H4 Chart
Analyzing the Gold market on the H4 time frame, as depicted in the provided chart, it’s evident that several technical indicators are being employed to gauge the metal’s price momentum and potential future direction. The Ichimoku Cloud, MACD, and RSI are prominent on this chart, each providing unique insights into market dynamics. The Ichimoku Cloud presents a mixed signal; the price is oscillating around the cloud, which typically indicates a lack of a strong trend in either direction. The cloud’s span is relatively thin, suggesting that the market is not heavily biased towards bullish or bearish sentiment and might be in a state of indecision or consolidation.
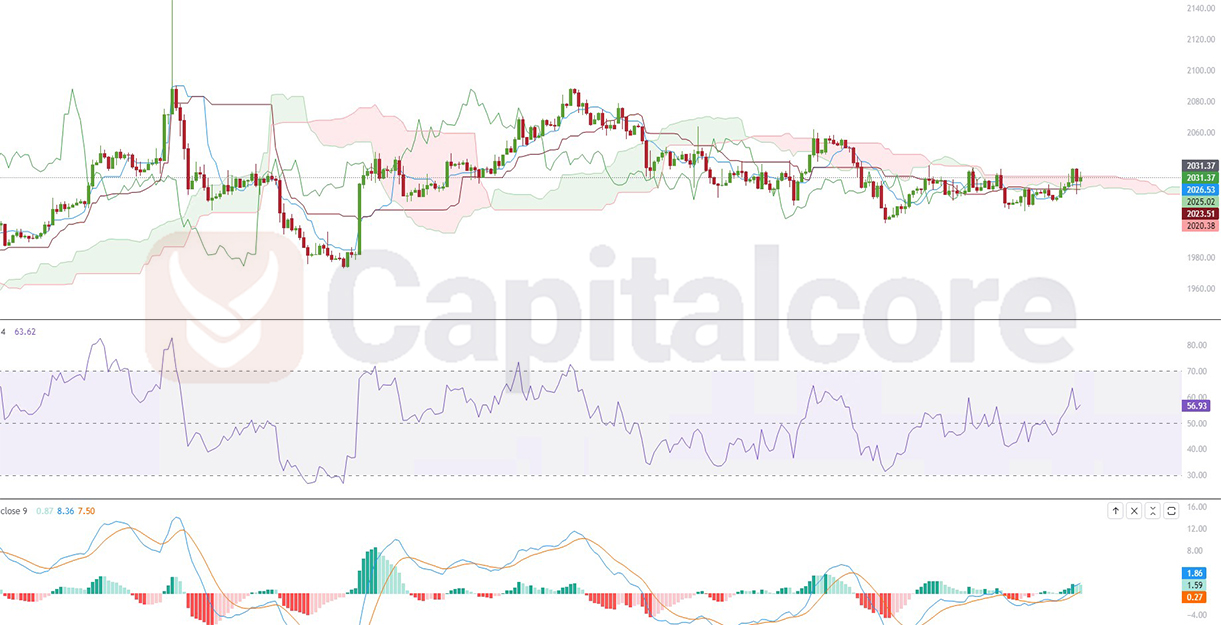
Chart Notes:
• Chart time-zone is UTC (+03:00)
• Candles’ time-frame is 4h.
The MACD indicator, positioned below the price chart, shows the MACD line (blue) is currently above the signal line (orange), which typically suggests bullish momentum. However, the histogram reflects a recent decrease in bullish intensity, indicating that the upside momentum may be waning. Meanwhile, the RSI, which measures the velocity and magnitude of directional price movements, is hovering around the mid-line, neither in the overbought nor oversold territory. This aligns with the price action near the Ichimoku Cloud, reinforcing the possibility of a consolidation phase or an impending direction change. Traders may want to watch for a potential crossover of the MACD lines or a breakout from the Ichimoku Cloud for stronger directional cues.
• DISCLAIMER: Please note that the above analysis is not an investment suggestion by “Capitalcore Ltd”. This post has been published only for educational purposes.