- March 21, 2024
- Posted by: capadmin
- Category: Market News
Shining Through the Cloud: Gold’s Ichimoku Breakout
Gold, a precious metal with deep historical significance in the financial world, has long been a staple in investment portfolios as a hedge against inflation and currency devaluation. Technical analysis for gold involves studying price charts and employing various indicators to gauge market sentiment and forecast potential price movements.

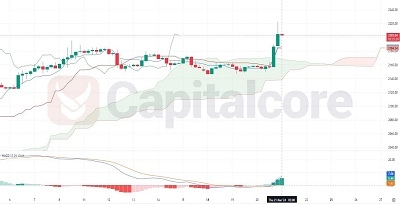
Chart Notes:
• Chart time-zone is UTC (+03:00)
• Candles’ time-frame is 4h.
The chart showcases the technical analysis of gold using the Ichimoku Cloud and the Moving Average Convergence Divergence (MACD) indicator. The gold price has just pierced through the Ichimoku Cloud with a substantial green candlestick, indicating a potential bullish trend reversal or a strong upward momentum. This price action is also accompanied by a bullish crossover in the MACD, evidenced by the expanding green histogram above the signal line, further corroborating the strength of the trend.
Given the recent price action and the alignment of both the Ichimoku and MACD indicators, the outlook for gold is currently optimistic. However, it’s important for traders to monitor for any signs of reversal or consolidation, as such steep inclines can sometimes be followed by retracements.
• DISCLAIMER: Please note that the above analysis is not an investment suggestion by “Capitalcore Ltd”. This post has been published only for educational purposes.