- November 29, 2023
- Posted by: capadmin
- Category: Market News
Bullish Crossover in Gold Analysis
The current positioning of the Moving Averages (MA) below the candlesticks in the gold market suggests a bullish trend. Typically, when the price action is above the MA, it indicates that the market is experiencing upward momentum. This setup often encourages buyers, as it signals strength in the market. Traders might view this as a confirmation of a potential upward trajectory in the short to medium term, as long as the price continues to stay above these moving averages.
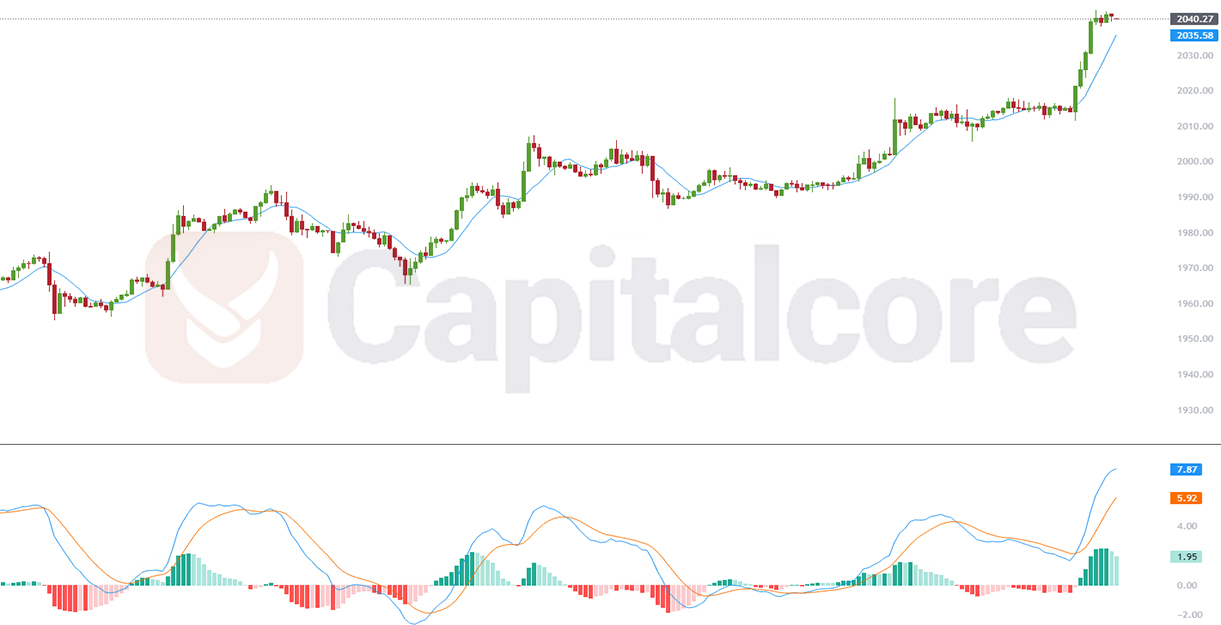
Chart Notes:
• Chart time-zone is UTC (+03:00)
• Candles’ time-frame is 4h.
The MACD indicator presents a further bullish signal. The appearance of green histogram bars indicates growing bullish momentum. Moreover, both the MACD and signal lines being above the histogram and the MACD line crossing above the signal line reinforce this bullish outlook. This crossover is a classical buy signal in technical analysis, suggesting an increase in upward momentum. Given these indicators, traders might expect continued bullish behavior in the gold market, at least in the immediate future. It’s important to monitor these indicators closely for signs of a trend reversal or continuation.
Overall, combining the insights from both the MA and MACD, the current technical analysis points towards a bullish scenario for gold. However, as with all market analyses, these indicators should be used in conjunction with other tools and market news to make informed trading decisions.
• DISCLAIMER: Please note that the above analysis is not an investment suggestion by “Capitalcore Ltd”. This post has been published only for educational purposes.