- March 19, 2024
- Posted by: capadmin
- Category: Market News
Deciphering Gold’s Next Move: Will the Ichimoku Cloud Usher in a Bullish Trend?
Upon examining the provided chart for gold, it is observed that the price is currently testing the Ichimoku Cloud from below, which often acts as a key dynamic resistance area. The recent price action is hovering around the cloud’s lower boundary, indicating a potential indecision phase between buyers and sellers. If the price sustains above the cloud, it could signal a shift to a bullish outlook, whereas a rejection could lead to a continuation of the downtrend.
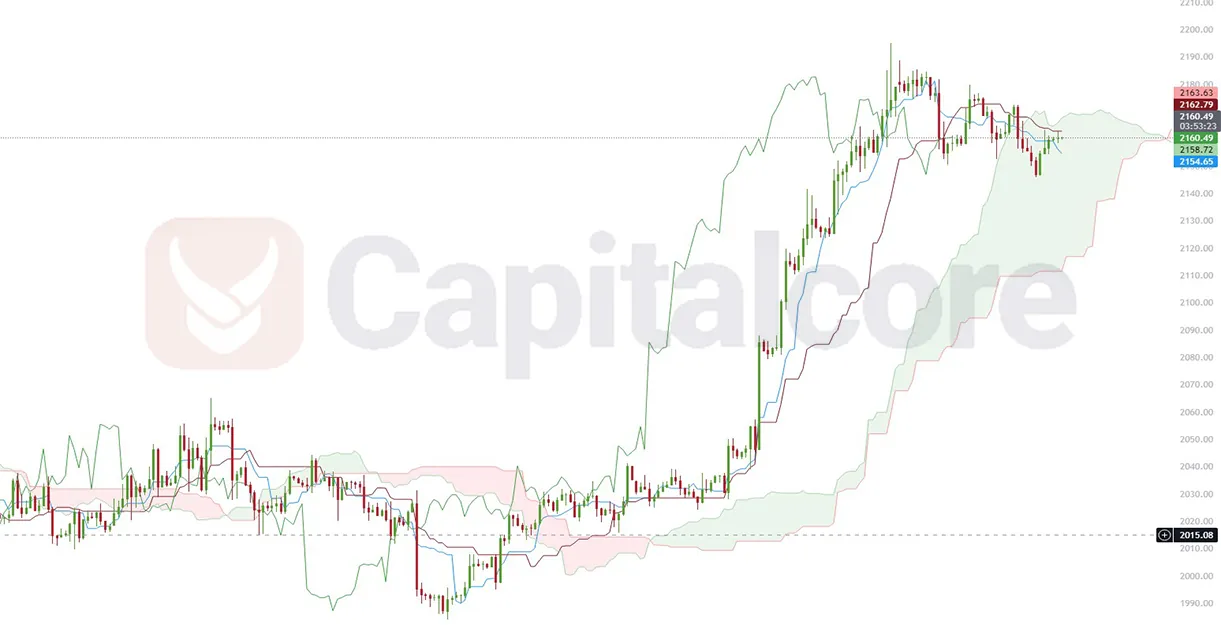
Chart Notes:
• Chart time-zone is UTC (+03:00)
• Candles’ time-frame is 4h.
The Moving Average lines appear to be converging within the Ichimoku Cloud, suggesting a consolidation phase. Traders will be closely watching these levels for a decisive breakout. A sustained move above the cloud could attract further buying interest, while a drop below could see the price seeking support at the previous low around 2015.08, marked by the dashed horizontal line on the chart. The near-term market sentiment is likely to be determined by the price interaction with the Ichimoku Cloud.
• DISCLAIMER: Please note that the above analysis is not an investment suggestion by “Capitalcore Ltd”. This post has been published only for educational purposes.