- February 12, 2024
- Posted by: capadmin
- Category: Market News
Gold’s H4 Chart: A Technical Tug-of-War
Gold’s price dynamics often reflect a multitude of global economic factors, making its technical analysis a critical tool for investors. The H4 timeframe provides a granular view of the market’s sentiment and price action, crucial for intermediate-term trading strategies. Here we delve into the technical nuances that currently shape the gold market’s landscape.

Chart Notes:
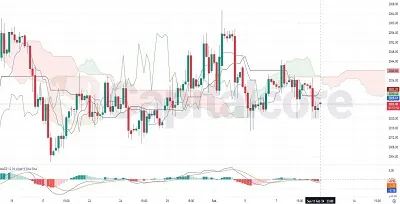
• Chart time-zone is UTC (+03:00)
• Candles’ time-frame is 4h.
The H4 chart for gold exhibits a fluctuating journey through a dense Ichimoku cloud, suggesting a market in a state of equilibrium, with neither bulls nor bears taking a definitive lead. The recent price action below the cloud hints at potential resistance, with a bearish sentiment as prices struggle to break through. The MACD indicator remains in negative territory below the signal line, reinforcing this bearish outlook. However, the histogram shows diminishing bearish momentum, indicating a possible slowdown in selling pressure. The overlapping of the Senkou Span lines within the cloud indicates that gold is currently traversing a period of uncertainty, often associated with consolidation or indecision among traders.
• DISCLAIMER: Please note that the above analysis is not an investment suggestion by “Capitalcore Ltd”. This post has been published only for educational purposes.