- October 4, 2023
- Posted by: capadmin
- Category: Market News
Bearish Descent Confronted with Oversold RSI Indicators
Gold, a benchmark for wealth preservation, is presently in the throes of a predominantly bearish trend. This scenario is accentuated as the chart paints a gloomier picture with the RSI indicators. As the asset dips near the critical level, the RSI line is anchored below the 30 threshold, traditionally suggesting an oversold territory. Amplifying this sentiment is the RSI-based MA, which too languishes below the 30 mark, echoing the strong bearish tones that are presently overshadowing this metal.
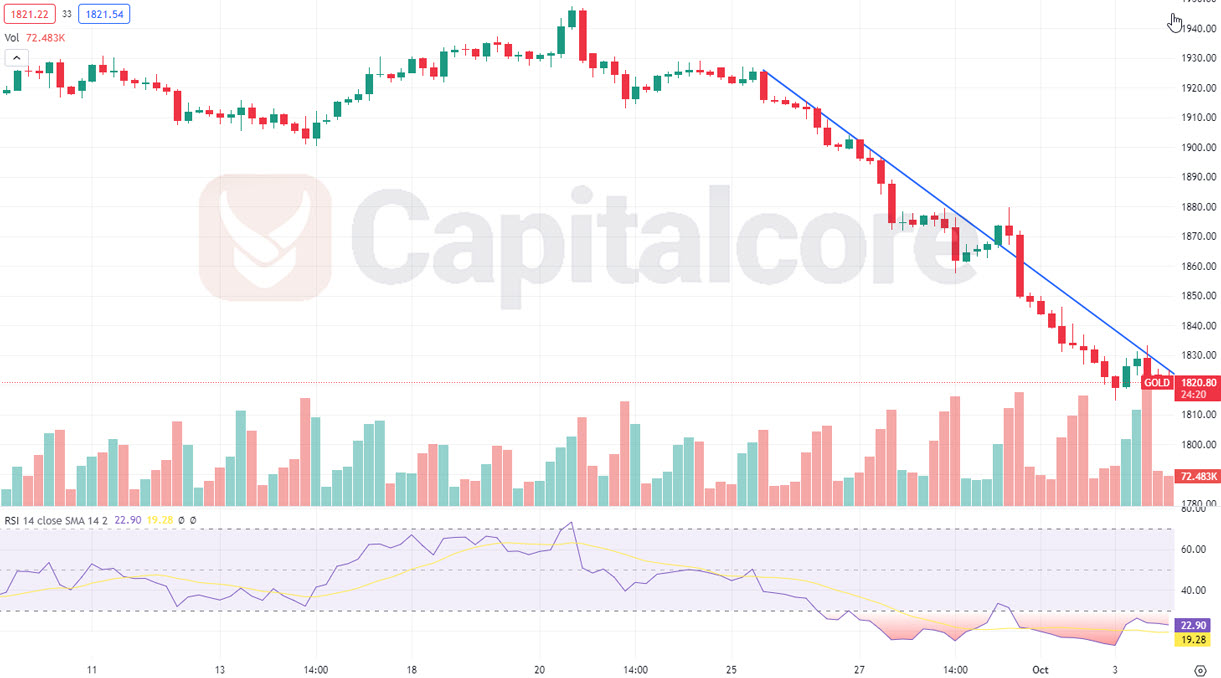
Chart Notes:
• Chart time-zone is UTC (+03:00)
• Candles’ time-frame is 4h.
Gold’s price action currently manifests a primary bearish trend. As the RSI indicators signal potential oversold conditions, traders find themselves at an important crossroads. While an RSI value below 30 can sometimes be a precursor to a rebound due to market corrections, the corroborating evidence from the RSI-based MA, stationed under the same threshold, adds another layer of gravity to the bearish sentiment.
For traders, this necessitates a heightened level of scrutiny. A rebound from the current levels, while aligned with the potential of oversold conditions, should be met with confirmatory signals from other technical metrics, perhaps candlestick patterns or support zones. Moreover, given Gold’s stature in global finance and its susceptibility to economic shifts, monitoring the fundamental narratives around the world is pivotal. An integrated approach, combining both technical and fundamental evaluations, will be indispensable for traders to chart the course ahead.
• DISCLAIMER: Please note that the above analysis is not an investment suggestion by “Capitalcore Ltd”. This post has been published only for educational purposes.