- April 2, 2024
- Posted by: capadmin
- Category: Market News
Gold’s Market Sentiment: A Technical View
Gold, traditionally seen as a safe-haven asset, often garners increased attention during times of economic uncertainty. Its price is influenced by a variety of factors, including inflation rates, currency values, and global political climate. Investors closely monitor its performance for signs of market sentiment and potential shifts in investment strategy.
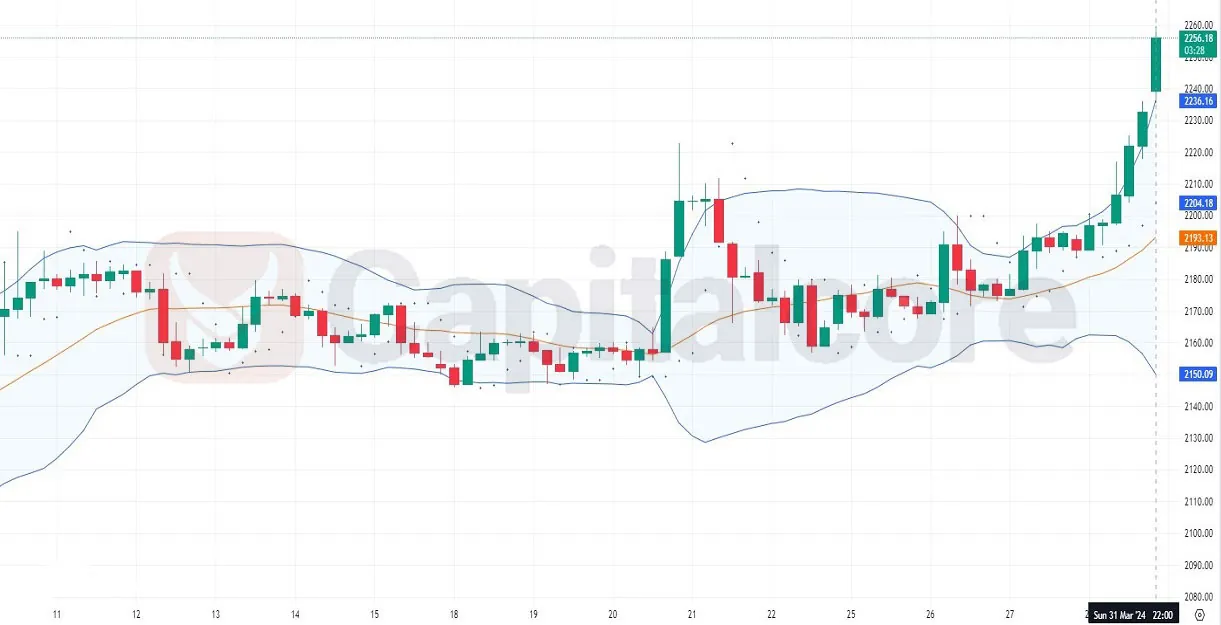
Chart Notes:
• Chart time-zone is UTC (+03:00)
• Candles’ time-frame is 4h.
The H4 chart for Gold indicates a robust bullish trend with a significant breakout above the Bollinger Bands. This move, paired with a steep upward trajectory, suggests strong buying pressure. The candles consistently closing above the moving average underscore buyer control. The recent pullback was shallow, indicating underlying strength in the uptrend. The Bollinger Bands have expanded, reflecting increased volatility and a possible continuation of the trend. Typically, such a decisive move away from the moving average might foreshadow a potential overextension, urging caution among buyers for signs of retracement.
• DISCLAIMER: Please note that the above analysis is not an investment suggestion by “Capitalcore Ltd”. This post has been published only for educational purposes.