- April 15, 2024
- Posted by: capadmin
- Category: Market News
Charting Gold’s Climb: Key Levels to Watch
Gold’s status as a haven asset often sees its price influenced by global economic indicators and market sentiment. The technical analysis for Gold on the H4 timeframe offers insights into the latest trends and potential future movements. Understanding the interplay of various technical indicators can provide a clearer picture of Gold’s trajectory in the near term.
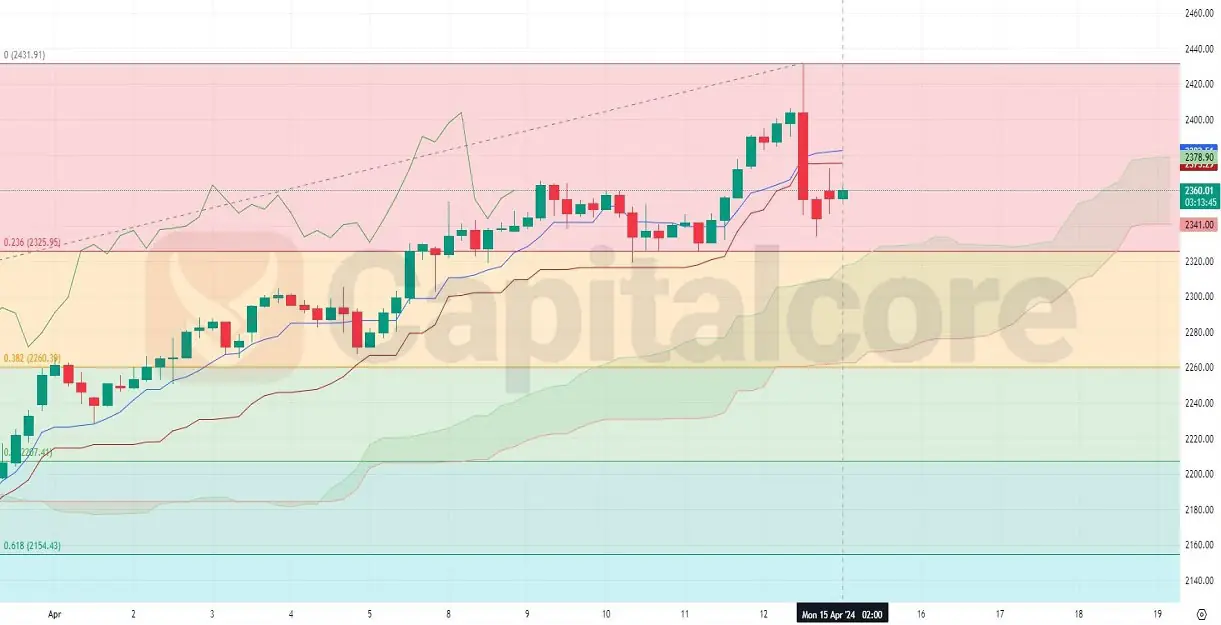
Chart Notes:
• Chart time-zone is UTC (+03:00)
• Candles’ time-frame is 4h.
The H4 chart for Gold reveals a bullish outlook as price action has taken a positive turn. After a brief consolidation period, Gold prices have breached a key resistance level, suggesting a potential uptrend. The Ichimoku Cloud is beginning to project a support zone, with the price now trading above the cloud, indicating a strong buy signal. Fibonacci retracement levels from recent swings show the price stabilizing above the 0.236 level at $2325.95, which may now serve as support. The leading span A of the Ichimoku Cloud is trending upwards and looks poised to cross above the leading span B, which would confirm bullish sentiment. Given these factors, the outlook for Gold is optimistic, suggesting an increase in price is on the horizon.
• DISCLAIMER: Please note that the above analysis is not an investment suggestion by “Capitalcore Ltd”. This post has been published only for educational purposes.