- April 26, 2024
- Posted by: capadmin
- Category: Market News
Glittering Opportunities: Gold’s Latest Technical Outlook
Gold, as a precious metal, holds a unique position in the financial markets, acting both as a commodity and a monetary asset. Its price is influenced by a variety of factors including central bank policies, market sentiment, and global economic stability. On the H4 chart, gold’s volatility provides an intricate picture of these influences at play.
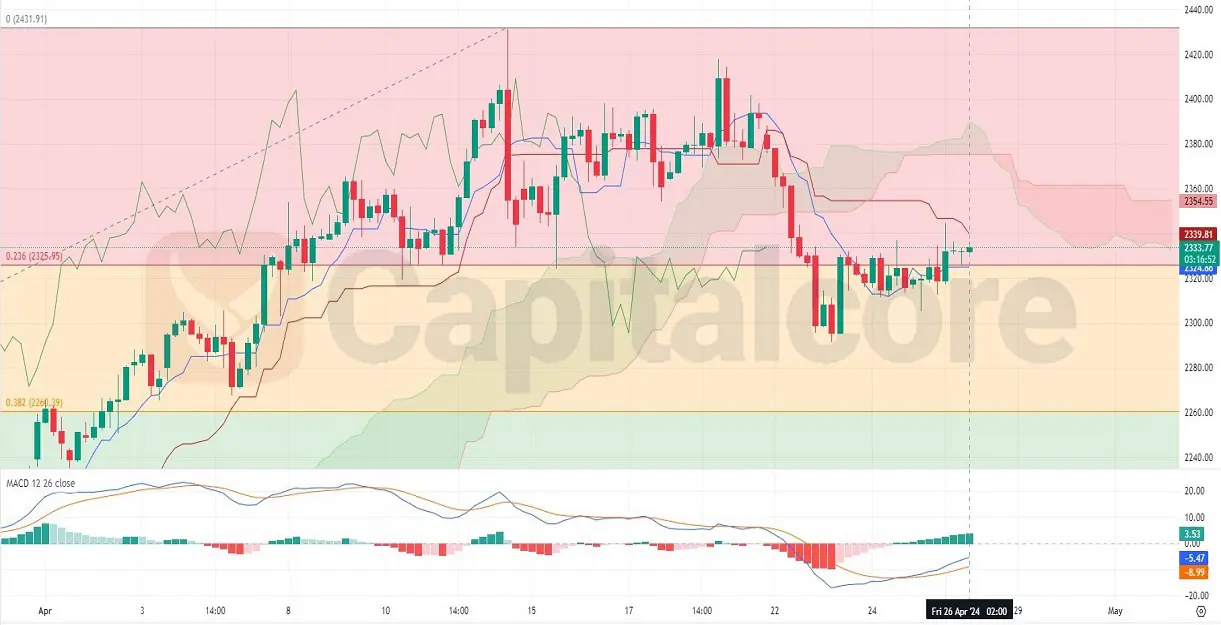
Chart Notes:
• Chart time-zone is UTC (+03:00)
• Candles’ time-frame is 4h.
On the H4 chart for gold, the price is currently testing the Ichimoku cloud from below, which may act as resistance. The MACD indicator shows a bullish crossover, with the signal line crossing below the MACD line, potentially indicating an upward momentum. However, the presence of bearish MACD bars suggests caution. Gold prices have retraced to the 0.236 Fibonacci level after a recent decline, and a sustained break above this could lead to testing the 0.382 level, while failure to breach the cloud may result in a retest of recent lows.
• DISCLAIMER: Please note that the above analysis is not an investment suggestion by “Capitalcore Ltd”. This post has been published only for educational purposes.