- April 22, 2024
- Posted by: capadmin
- Category: Market News
Gold H4: Ichimoku and MACD Insights
Gold has been a valuable commodity for centuries, serving as a symbol of wealth and a hedge against economic uncertainty. Its allure is rooted in its scarcity, aesthetic appeal, and its role as a diversifier in investment portfolios. Often perceived as a safe-haven asset, gold’s price dynamics can be an indicator of investor sentiment during times of market volatility.
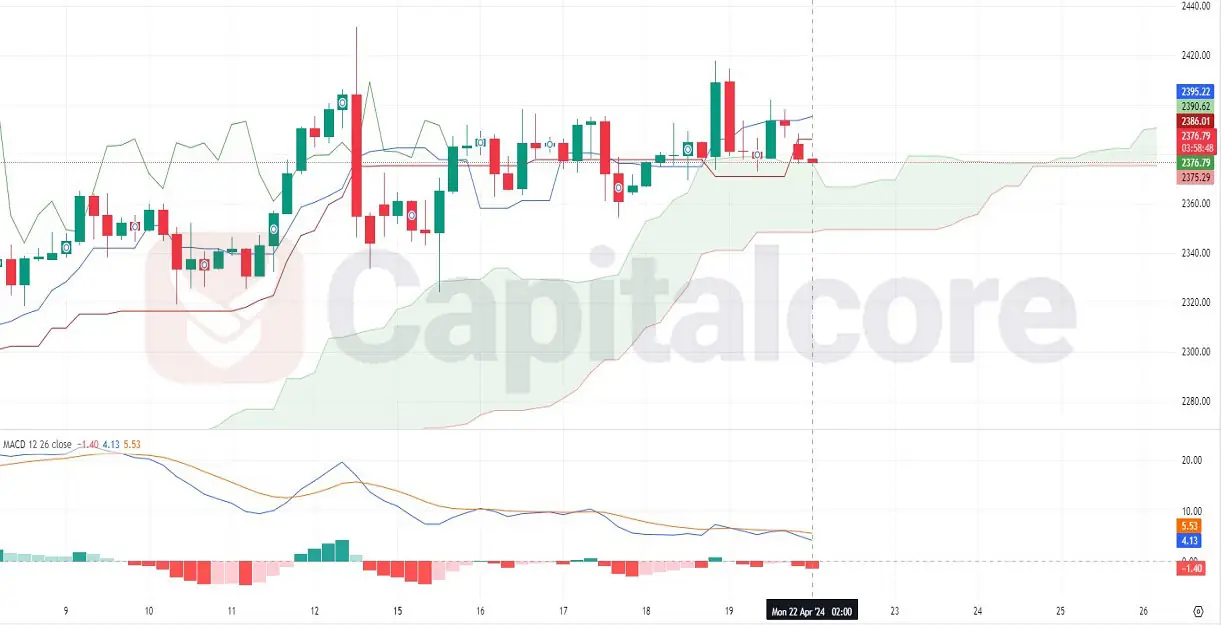
Chart Notes:
• Chart time-zone is UTC (+03:00)
• Candles’ time-frame is 4h.
In the provided H4 chart of gold, the Ichimoku Cloud appears to be in a state of equilibrium, with the price fluctuating around the cloud, suggesting a lack of strong trend in the immediate term. The recent crossover of the Tenkan-sen (red line) above the Kijun-sen (blue line) could be interpreted as a bullish signal, however, the price is currently beneath the cloud, which typically suggests bearish sentiment. This juxtaposition indicates a potential indecision in the market. The MACD histogram shows decreasing bullish momentum as the bars recede from the bullish zone and move closer to the baseline, hinting at a weakening uptrend or a possible impending bearish crossover, should the MACD line (blue) cross below the signal line (orange). The presence of multiple doji candles also indicates indecision among traders. Given these signals, traders might be cautious, looking for confirmation of a trend before taking positions. They might also monitor whether the price will stay within the cloud or break out, which could determine the direction of the next significant move.
• DISCLAIMER: Please note that the above analysis is not an investment suggestion by “Capitalcore Ltd”. This post has been published only for educational purposes.