- March 20, 2024
- Posted by: capadmin
- Category: Market News
Ichimoku & MACD: NZDCHF’s Trend on the Edge?
As we delve into the NZDCHF chart, the narrative woven by the Ichimoku Cloud and the MACD is one of cautious anticipation. The pair’s recent movement below the cloud suggests a bearish phase, yet the current push towards the cloud could be a sign of an emerging bullish correction. The critical question for traders now is whether this ascent signifies a temporary retracement or the early stages of a more significant bullish reversal.
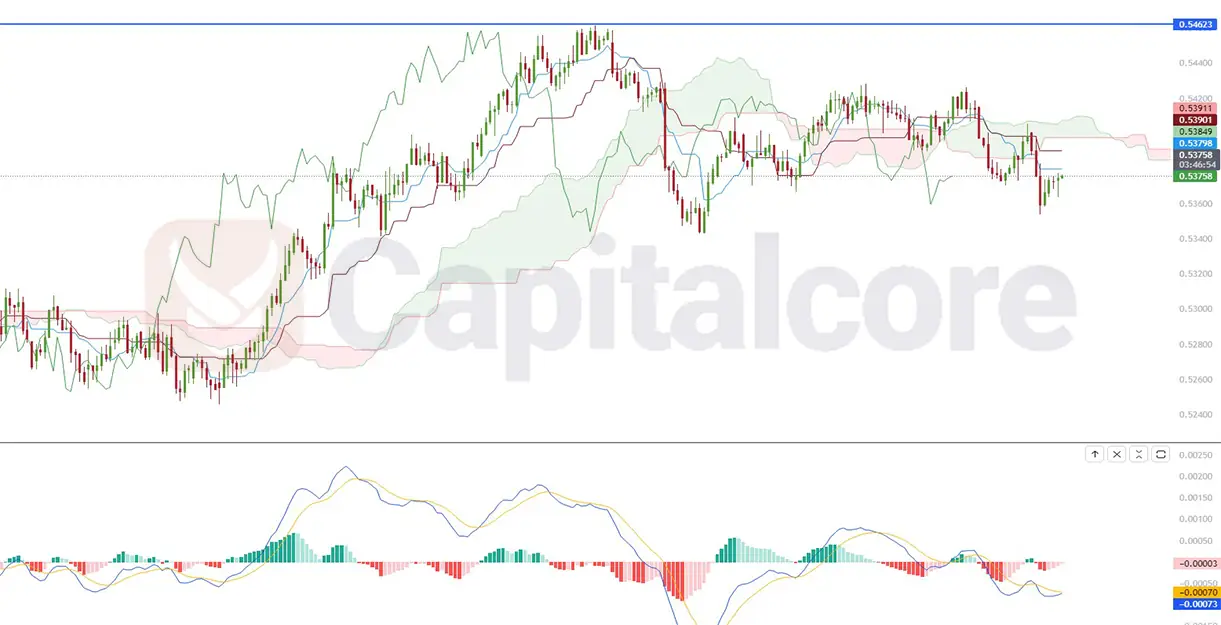
Chart Notes:
• Chart time-zone is UTC (+03:00)
• Candles’ time-frame is 4h.
The MACD supports this suspenseful story, with the MACD line having recently dipped below the signal line, which traditionally suggests bearish momentum. However, the decreasing length of the negative histogram bars may hint at a reduction in bearish intensity. Should the MACD line cross back above the signal line, it could be the bullish confirmation traders are watching for. For now, the convergence of signals from both the Ichimoku and MACD indicators puts the spotlight on the NZDCHF’s next move.
• DISCLAIMER: Please note that the above analysis is not an investment suggestion by “Capitalcore Ltd”. This post has been published only for educational purposes.