- February 6, 2024
- Posted by: capadmin
- Category: Market News
NZDJPY Technical Analysis: Navigating Through Market Indecision
The NZDJPY chart presents a picture of indecision as the price oscillates within the Ichimoku cloud, reflecting a balance between buying and selling forces. The recent price action has pierced through the cloud, hinting at a potential shift in momentum, but the lack of clear direction outside the cloud suggests uncertainty. The flat-lined Kijun-sen (blue line) indicates a lack of strong trend in the near term, and the price hovering around the cloud suggests a tug-of-war between bullish and bearish sentiment.
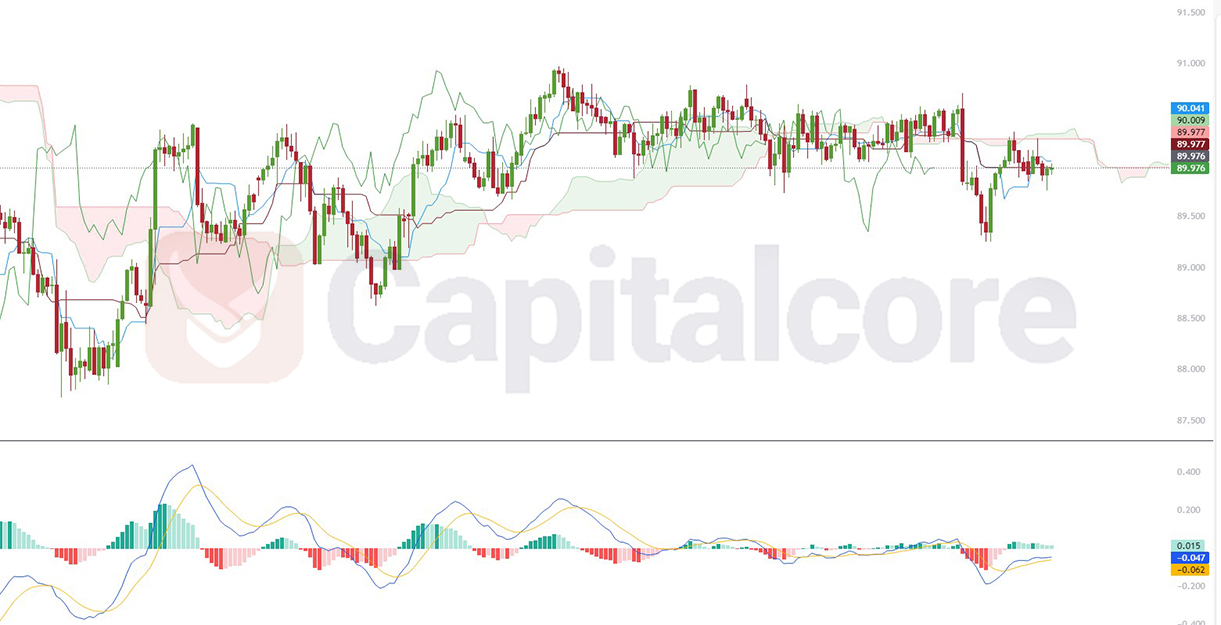
Chart Notes:
• Chart time-zone is UTC (+03:00)
• Candles’ time-frame is 4h.
Technical indicators on the chart offer mixed signals; the MACD histogram is close to the zero line with a slight bearish bias as the bars descend below it, suggesting a loss of upward momentum. However, the MACD line itself is just weaving around the signal line, implying a market lacking conviction. Traders might await a more definitive signal from the Ichimoku components or the MACD line crossover relative to its signal line for a clearer directional bias. The convergence or divergence of these indicators with price action in the upcoming sessions will be crucial for determining the next significant move for the NZDJPY pair.
• DISCLAIMER: Please note that the above analysis is not an investment suggestion by “Capitalcore Ltd”. This post has been published only for educational purposes.