- April 23, 2024
- Posted by: capadmin
- Category: Market News
BTC/USD: Potential for Continued Rise
Bitcoin, the world’s foremost cryptocurrency, is constantly under the scrutiny of traders and analysts alike, with its price against the US dollar (BTC/USD) serving as a critical gauge of market sentiment. The following technical analysis explores the BTC/USD pair through the lens of the Ichimoku Cloud, MACD, and Fibonacci retracement levels to discern potential market movements. Such analyses aim to provide insights into future price trajectories and possible strategic entry and exit points for traders.
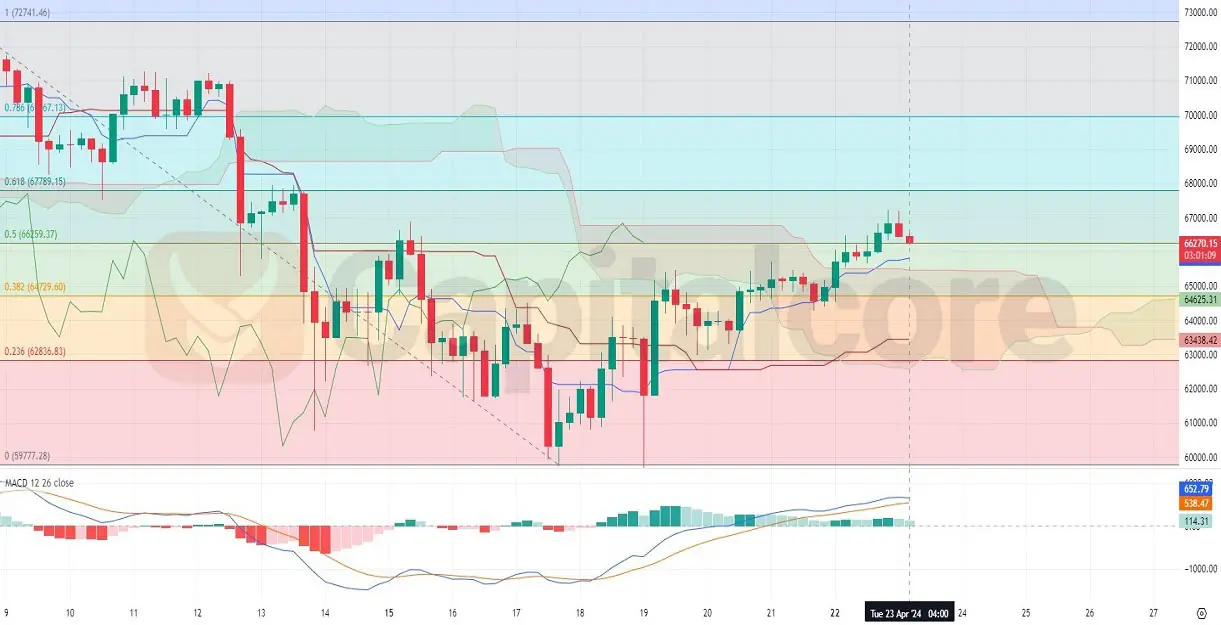
Chart Notes:
• Chart time-zone is UTC (+03:00)
• Candles’ time-frame is 4h.
Looking at the BTC/USD chart, the price is currently testing the upper boundary of the Ichimoku Cloud, suggesting a potential resistance zone. The conversion line (blue) is above the baseline (red), which typically indicates bullish momentum; however, the proximity of the price to the cloud suggests caution. The MACD indicator shows a positive momentum as the MACD line (blue) is above the signal line (orange) and above the zero line, which is typically a bullish signal. The histogram also shows increasing bullish momentum with higher green bars. The Fibonacci retracement tool, drawn from a recent high to low, shows that the price is hovering just below the 0.786 retracement level, having successfully breached the 0.618 level, indicating strong upward movement. The convergence of these indicators suggests an overall bullish outlook, but traders may look for a confirmed break above the cloud for a clearer long entry signal, keeping in mind potential pullbacks to the support levels at 0.618 or 0.5 Fibonacci levels if the price is rejected at the current level.
• DISCLAIMER: Please note that the above analysis is not an investment suggestion by “Capitalcore Ltd”. This post has been published only for educational purposes.