- January 12, 2024
- Posted by: capadmin
- Category: Market News
LTCUSD Technicals: Ichimoku Cloud In Focus
The LTCUSD pair, which tracks the value of Litecoin against the US Dollar, is a popular instrument among cryptocurrency traders. This technical analysis will examine the pair’s recent movements on the H4 timeframe, scrutinizing key indicators and chart patterns to forecast potential price action. The following analysis aims to provide insights into the pair’s market sentiment and possible future direction.
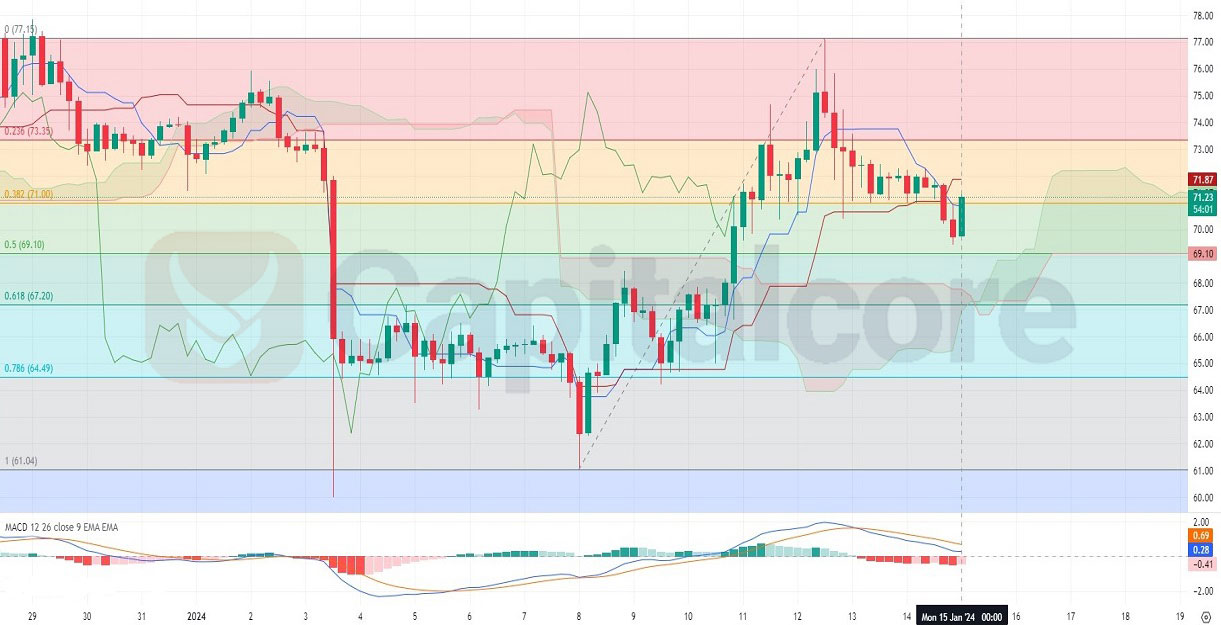
Chart Notes:
• Chart time-zone is UTC (+03:00)
• Candles’ time-frame is 4h.
On the H4 chart for LTCUSD, the price has encountered resistance, leading to a bearish retracement. The Ichimoku Cloud is beginning to signal potential consolidation as the price teeters at the cloud’s edge. A bearish crossover in the MACD below the baseline suggests waning bullish momentum, while the RSI nears the 50-level, indicating a neutral market state. The recent price dip touched the Fibonacci retracement level of 0.618, hinting at a possible area of support. If the price sustains above this level, it could signal a recovery, whereas a break below could intensify selling pressure. The Parabolic SAR dots above the price candles are affirming the downward pressure. Traders may watch for the price to either break through the Ichimoku Cloud or retreat further to determine the medium-term trend bias.
• DISCLAIMER: Please note that the above analysis is not an investment suggestion by “Capitalcore Ltd”. This post has been published only for educational purposes.