- May 3, 2024
- Posted by: capadmin
- Category: Market News

EURAUD H4 Analysis: Key Indicators Point to Potential Reversal
The EUR/AUD pair, depicting the exchange between the Euro and the Australian Dollar, has shown significant fluctuations lately. This technical analysis, conducted on the H4 timeframe, leverages Bollinger Bands, MACD, and Fibonacci retracement tools to decipher current and upcoming market trends.
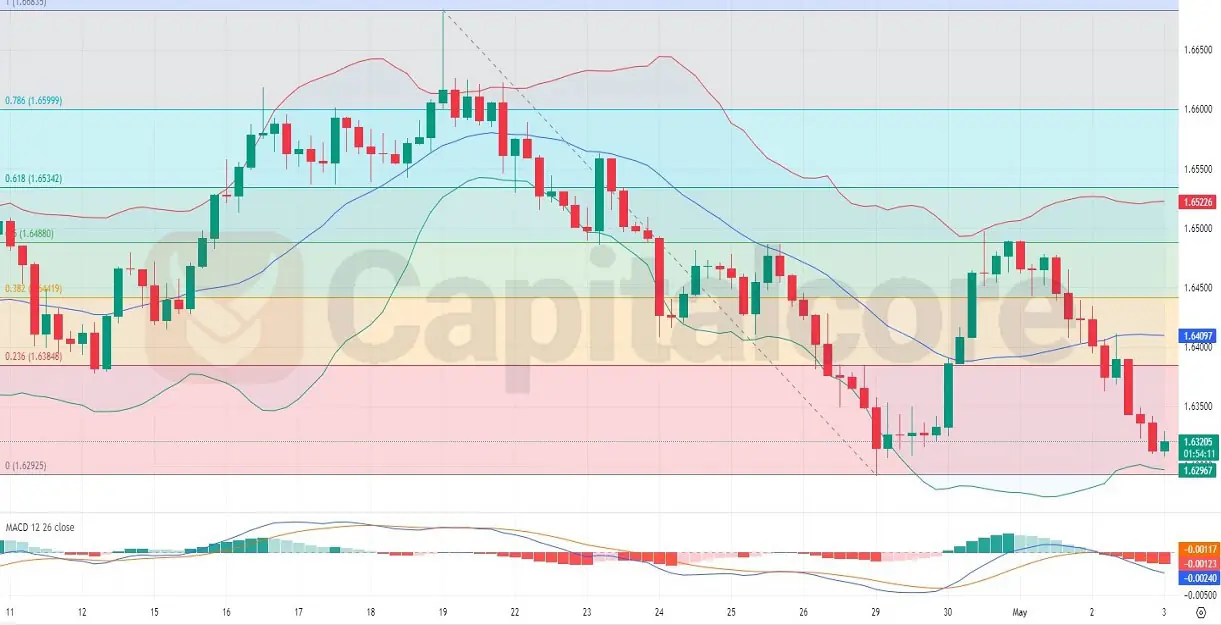
Chart Notes:
• Chart time-zone is UTC (+03:00)
• Candles’ time-frame is 4h.
In the H4 timeframe analysis of the EUR/AUD pair, the currency shows intriguing dynamics as it approaches key technical levels. Notably, the price is hovering near the lower Bollinger Band, suggesting potential oversold conditions that could precede a rebound or price stabilization. Concurrently, the MACD indicator supports a bearish outlook with the MACD line remaining below the signal line, though a reduction in negative momentum indicates a potential slowdown in the downward trend. The presence near the 0.382 Fibonacci retracement level further implies a possible support area. The last ten candles feature seven declines offset by three bullish candles, including the latest one, pointing to a budding buying interest. This mix of signals advises traders to remain alert for signs of a bullish reversal, especially if supported by an increase in trading volume or additional positive candle formations near critical Fibonacci levels.
• DISCLAIMER: Please note that the above analysis is not an investment suggestion by “Capitalcore Ltd”. This post has been published only for educational purposes.