- May 22, 2024
- Posted by: capadmin
- Category: Market News

Bullish Momentum Sustained
The chart depicts the New Zealand Dollar (NZD) versus the Canadian Dollar (CAD) on a 4-hour timeframe, showcasing price movements and technical indicators over a span of approximately two months. The price action reveals a significant downtrend at the beginning, followed by a reversal around mid-April, leading into a more bullish trend in recent weeks. The Parabolic SAR dots above and below the price bars indicate the trend direction, confirming the initial downtrend and the subsequent upward momentum. Recently, the price appears to be consolidating after a notable rise, suggesting a potential pause or reversal in the current trend.
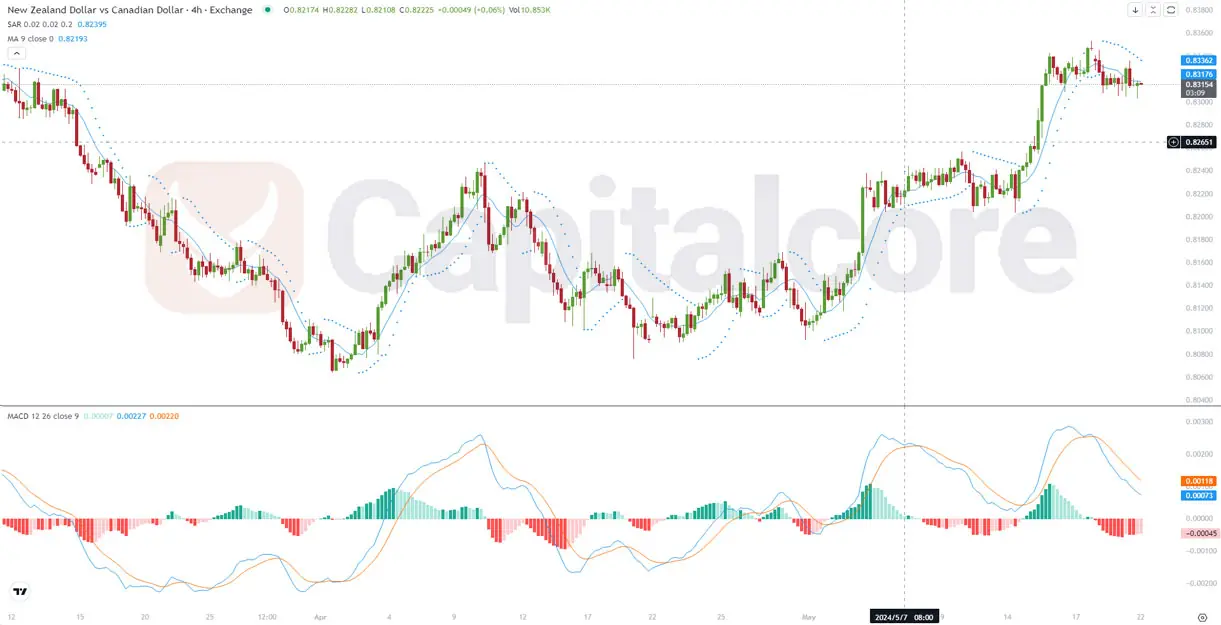
Chart Notes:
• Chart time-zone is UTC (+03:00)
• Candles’ time-frame is 4h.
Additionally, the MACD (Moving Average Convergence Divergence) at the bottom of the chart provides further insight into the market’s momentum. The MACD line crossing above the signal line in mid-April aligns with the observed price reversal, indicating a shift from bearish to bullish momentum. The histogram bars also reflect this change, turning from red to green as the buying pressure increased. Currently, the MACD lines are converging, which could imply a potential weakening of the bullish momentum and hint at possible consolidation or a bearish reversal. Overall, the chart suggests that while the recent trend has been upward, caution is warranted as momentum indicators suggest a potential change in market direction.
• DISCLAIMER: Please note that the above analysis is not an investment suggestion by “Capitalcore Ltd”. This post has been published only for educational purposes.