- May 13, 2024
- Posted by: capadmin
- Category: Market News

NZD/USD Faces Downward Pressure
The NZD/USD currency pair, commonly referred to as the “Kiwi,” represents the exchange rate between the New Zealand Dollar and the US Dollar. This pair is heavily influenced by various economic indicators from both New Zealand and the United States, with New Zealand’s agricultural exports playing a significant role in its valuation. Recently released data, including the BusinessNZ Services Index and the Food Price Index (FPI), along with the upcoming high-impact news on inflation expectations, are crucial in shaping the pair’s short-term movements and broader economic perceptions.
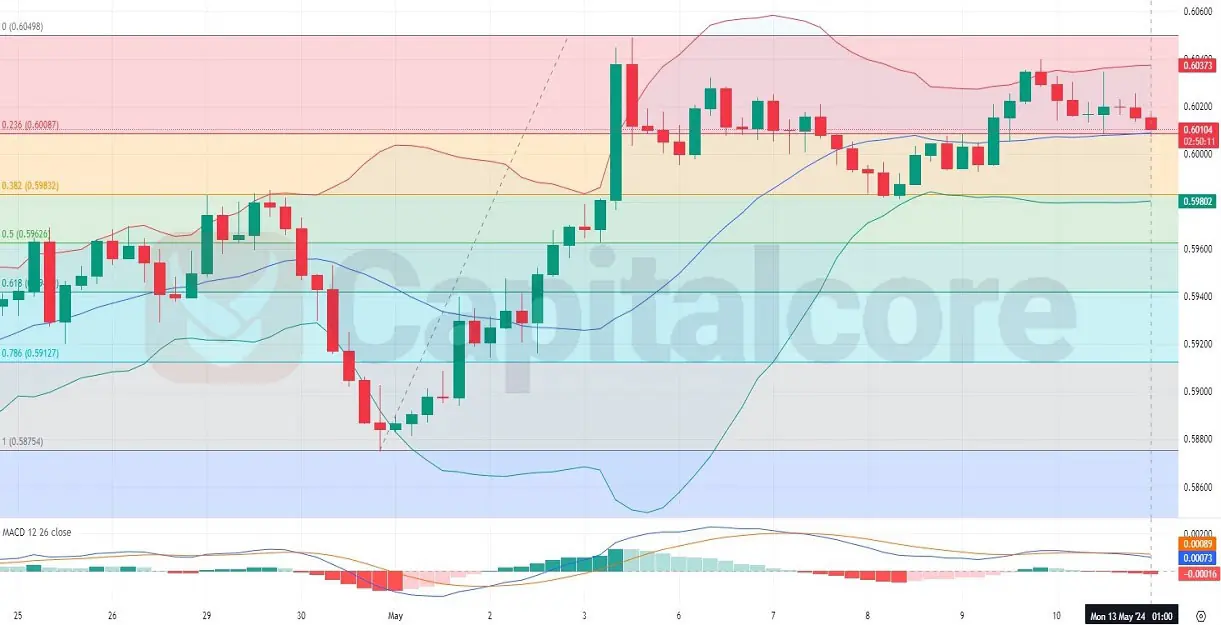
Chart Notes:
• Chart time-zone is UTC (+03:00)
• Candles’ time-frame is 4h.
The NZD/USD chart forecast today shows a recent downturn in momentum characterized by a series of bearish candles. The Bollinger Bands are tightening, which typically indicates decreased market volatility, and with the price currently in the upper half but moving towards the central Bollinger Band, there is a clear signal of potential downward movement. The bearish candle touching the middle line suggests that the price may continue to test lower levels if the bearish momentum persists. Furthermore, in the MACD indicator the macd line has crossed below its signal line with a negative histogram value of -0.00015, reinforcing the bearish momentum seen in the price action. The convergence of these technical indicators, coupled with negative economic data, paints a rather pessimistic picture for the NZD in the immediate future. Traders might consider this an opportune moment to scrutinize potential entries for short positions, especially if upcoming economic reports continue to underwhelm.
• DISCLAIMER: Please note that the above analysis is not an investment suggestion by “Capitalcore Ltd”. This post has been published only for educational purposes.