- August 3, 2023
- Posted by: Lewis Miller
- Category: Market News
Sideways Movement with Sell Signals
Welcome to our NZDUSD analysis, where the RSI dipping below the center line indicates bearish momentum, complemented by the short-term MA crossing below the long-term MA, signaling a prominent sell opportunity. The sideways price movement urges caution, as it could lead to potential consolidation before a breakout or breakdown. With RSI and MA aligning with the sideways trend, risk management is crucial, and monitoring support and resistance levels offer valuable trade insights.
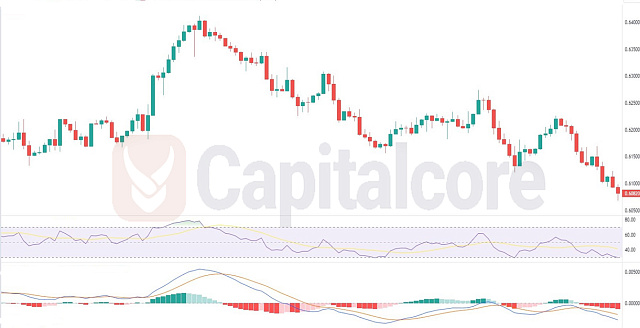
Chart Notes:
• Chart time-zone is UTC (+03:00)
• Candles’ time-frame is 4h.
The Relative Strength Index (RSI) has dipped below the center line, indicating a shift toward bearish momentum. Additionally, the short-term moving average (MA) crossing below the long-term MA serves as a prominent sell signal. The price movement appears to be in a sideways pattern, suggesting a lack of clear direction in the market. Traders should be cautious as the sideways movement could indicate consolidation before a potential breakout or breakdown. With RSI and MA signals aligning with the sideways trend, a bearish bias is currently favored. However, given the uncertain market conditions, risk management is paramount. Monitoring key support and resistance levels will help identify potential trade opportunities in this dynamic NZDUSD environment.
• DISCLAIMER: Please note that the above analysis is not an investment suggestion by “Capitalcore Ltd”. This post has been published only for educational purposes.