- September 19, 2023
- Posted by: capadmin
- Category: Market News
4H NZDUSD: Neutral RSI, Gentle SMA Crossover
In the NZDUSD forex pair on the 4-hour timeframe, the RSI near 50 and a gentle crossover of shorter SMA below the longer SMA reflect a market in a state of relative equilibrium with a subtle bearish inclination. Traders should exercise vigilance in this sideways environment and consider external factors that could steer the pair’s direction.
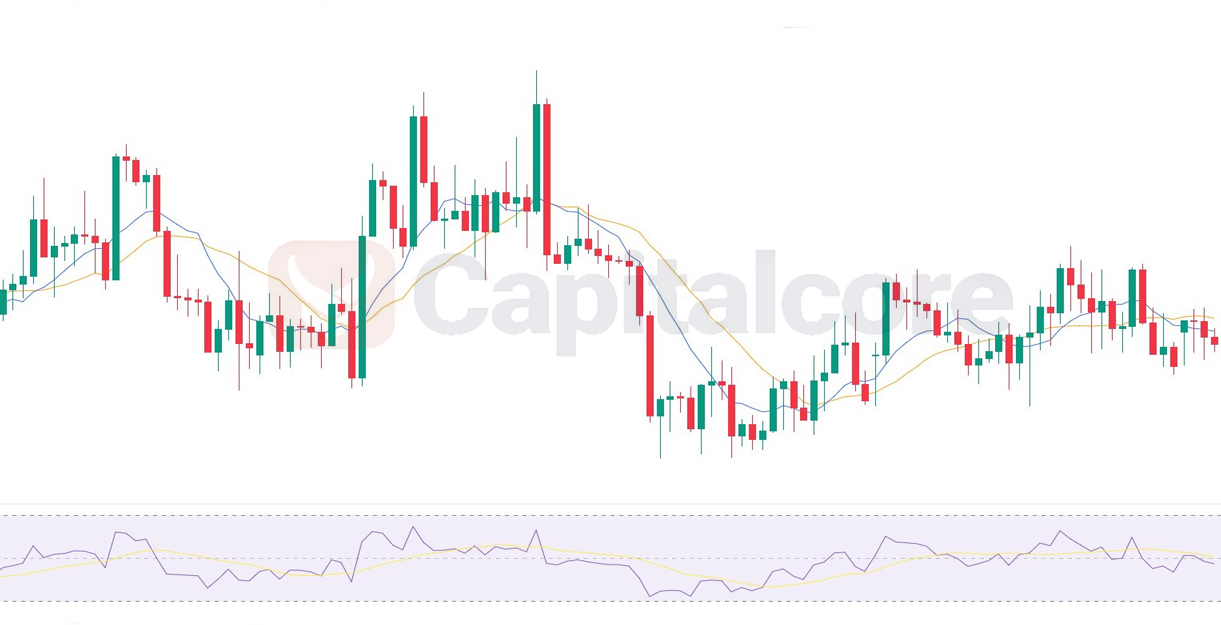
Chart Notes:
• Chart time-zone is UTC (+03:00)
• Candles’ time-frame is 4h.
In the NZDUSD pair, on the 4-hour timeframe, several key technical indicators provide insight into its current market condition. The Relative Strength Index (RSI) hovering around 50 suggests a neutral sentiment, indicating neither overbought nor oversold conditions. This aligns with the general sideways trend observed in recent price action.
The crossing of the shorter Simple Moving Average (SMA) below the longer SMA indicates a mild bearish bias but lacks a strong downward momentum. This crossover may signify a potential shift in sentiment, possibly influenced by economic factors or market sentiment.
Traders should exercise caution in such a sideways market with subtle bearish indications. It’s crucial to monitor other factors like economic news, geopolitical events, and broader market sentiment, as they can heavily influence price movements. Consider setting clear entry and exit points, implementing risk management strategies, and being prepared for potential reversals or further sideways movement in the NZDUSD pair.
• DISCLAIMER: Please note that the above analysis is not an investment suggestion by “Capitalcore Ltd”. This post has been published only for educational purposes.