- February 19, 2024
- Posted by: capadmin
- Category: Market News
NZDUSD: Climbing to New Heights?
The NZDUSD pair, a dynamic duo reflecting the interplay of the US and New Zealand economies, presents an intriguing technical setup that warrants a closer examination as market participants anticipate the next significant move.
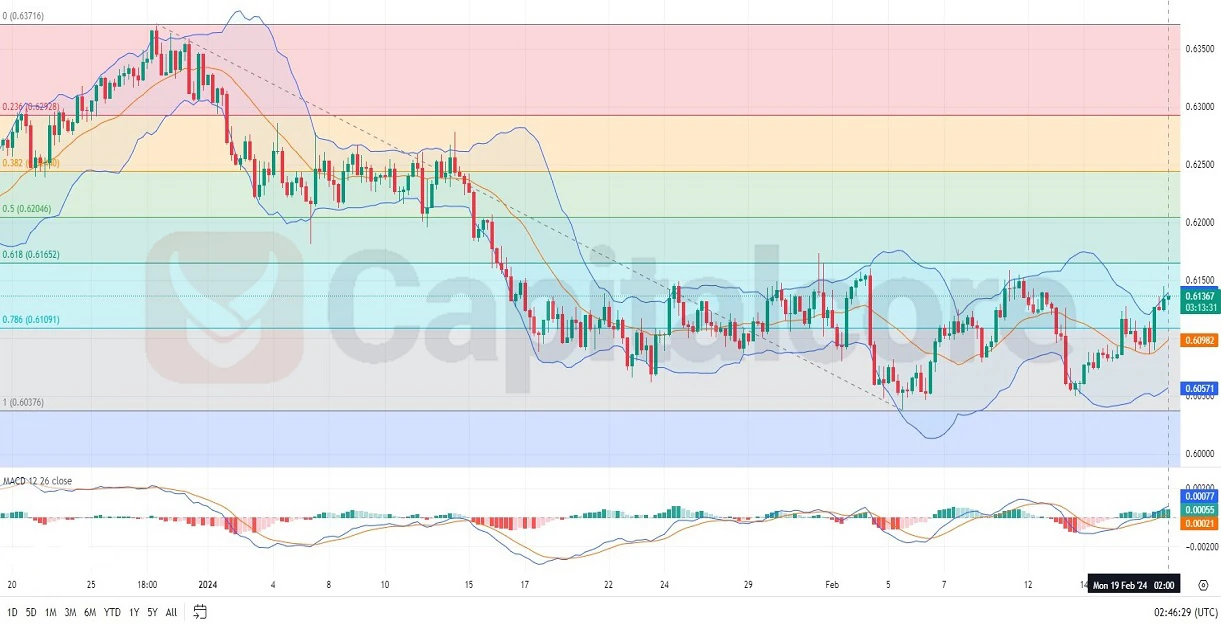
Chart Notes:
• Chart time-zone is UTC (+03:00)
• Candles’ time-frame is 4h.
Examining the H4 chart for NZDUSD, we observe a pronounced uptrend with the price action respecting an ascending channel pattern. The price is currently trading near the upper boundary of the Bollinger Bands, suggesting that the pair might be nearing a potential resistance zone. The MACD indicator, while still in positive territory, is showing a slight convergence that could hint at a loss of upward momentum. Additionally, the pair has recently retraced from the Fibonacci 61.8% level, which may act as resistance. As the RSI approaches the overbought threshold, traders should be cautious of a possible retracement or consolidation before any further bullish advancements. Support is seen near the middle Bollinger Band, aligning with the 50% Fibonacci retracement level.
• DISCLAIMER: Please note that the above analysis is not an investment suggestion by “Capitalcore Ltd”. This post has been published only for educational purposes.