- February 9, 2024
- Posted by: capadmin
- Category: Market News
Kiwi Climbs Skyward: H4 Ichimoku Insight
The NZDUSD currency pair, often referred to as the “Kiwi,” represents the exchange rate between the New Zealand Dollar and the US Dollar. This pair reflects the economic dynamics between the two nations and is influenced by factors such as trade relations, commodity prices, and interest rate differentials. It’s a popular pair for traders due to New Zealand’s stable economy and the US Dollar’s status as the world’s primary reserve currency.
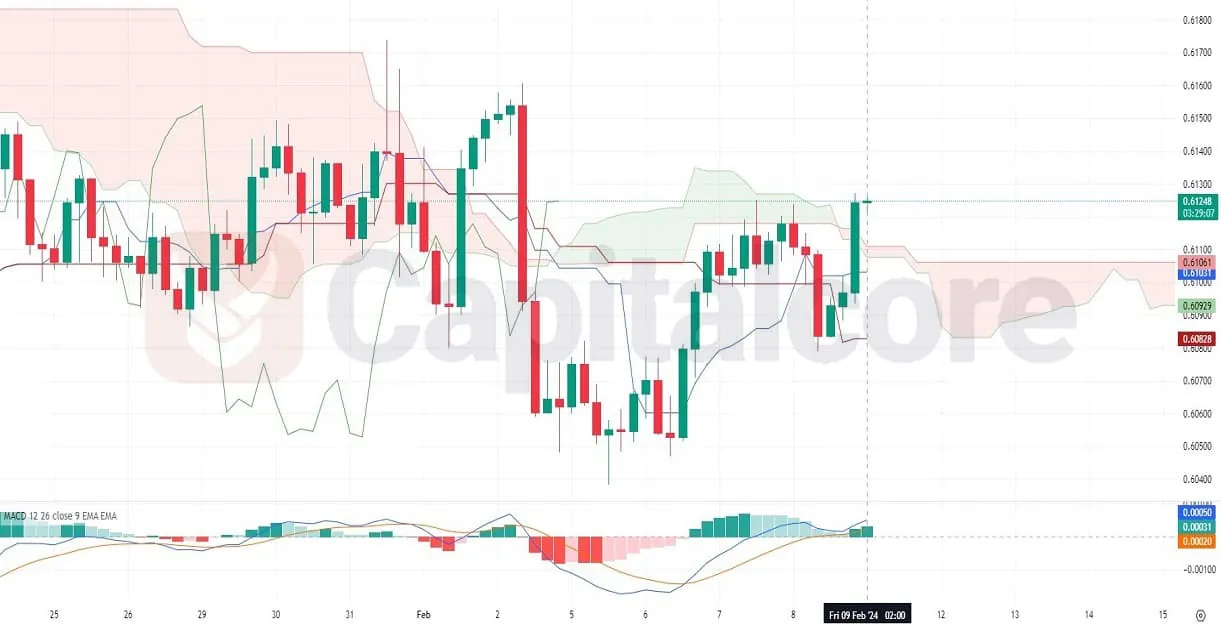
Chart Notes:
• Chart time-zone is UTC (+03:00)
• Candles’ time-frame is 4h.
The H4 chart for NZDUSD with Ichimoku and MACD indicators suggests a potential bullish momentum as the price is currently breaking through the Ichimoku cloud. This breakout, if sustained, could signal a shift from a neutral to a bullish market sentiment. The MACD is showing a positive divergence with increasing histogram bars, supporting the bullish case. The price above both the Ichimoku cloud and the baseline indicates buyers are gaining control. As the lagging span is approaching the price from below, it will be important to see if it remains above past price action, which would confirm the potential uptrend continuation. Traders might look for the cloud as a new support zone in case of pullbacks, with the recent price action suggesting a test of higher resistance levels.
• DISCLAIMER: Please note that the above analysis is not an investment suggestion by “Capitalcore Ltd”. This post has been published only for educational purposes.