- November 13, 2023
- Posted by: capadmin
- Category: Market News
MACD Confirms Downtrend in Platinum
The chart illustrates the price movement of Platinum over a series of H4 (4-hour) time intervals, as depicted by the candlestick patterns. The technical indicators included are Bollinger Bands, a Moving Average, and the MACD (Moving Average Convergence Divergence).
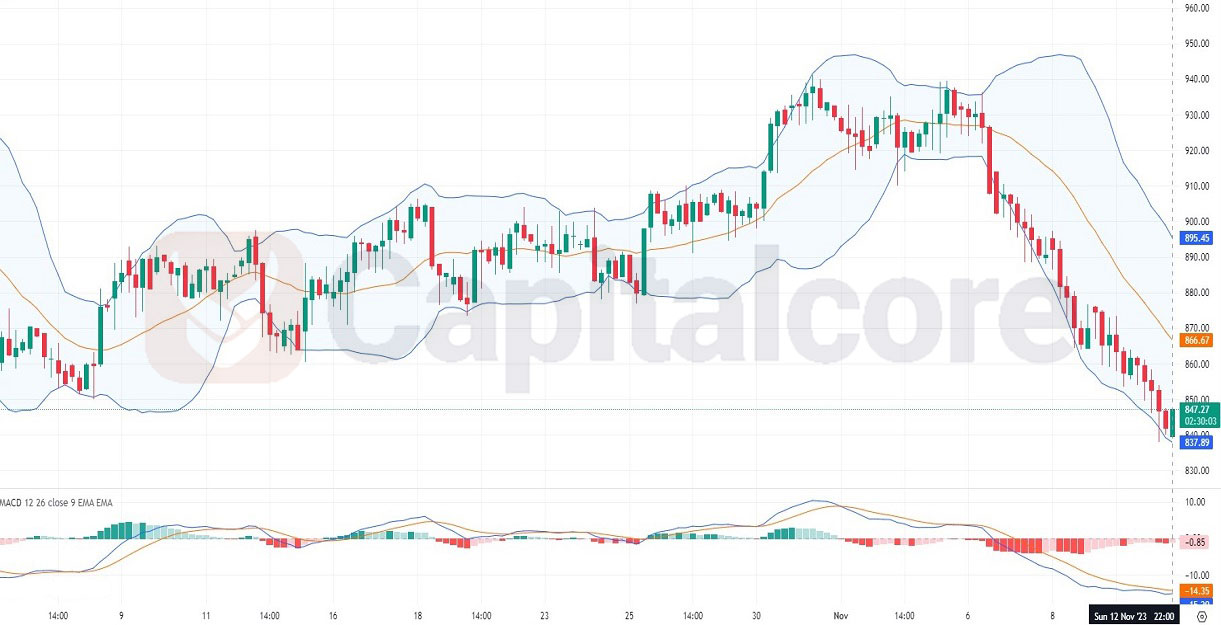
Chart Notes:
• Chart time-zone is UTC (+03:00)
• Candles’ time-frame is 4h.
The Platinum H4 chart shows a recent bearish trend, with prices falling sharply below the 20-period moving average, which suggests a strong downward momentum. The Bollinger Bands are widening, indicating increased market volatility as the price breaks below the lower band. The MACD histogram is below the signal line and descending, which confirms bearish sentiment in the market. The lack of bullish candles and consistent lower lows also point to a sustained seller’s market. The RSI (Relative Strength Index), although not visible on the chart, would likely register an oversold condition given the steep decline. Traders might look for potential support levels or signs of a reversal if the market becomes too extended to the downside.
• DISCLAIMER: Please note that the above analysis is not an investment suggestion by “Capitalcore Ltd”. This post has been published only for educational purposes.