- December 15, 2023
- Posted by: capadmin
- Category: Market News
H4 Chart Analysis: Silver’s Market Sentiment
Silver prices exhibit a dynamic interplay of supply and demand forces, with technical analysis offering insights into market sentiment and potential price movements. The following analysis on the H4 chart provides a snapshot of the current trends and patterns shaping the silver market.

Chart Notes:
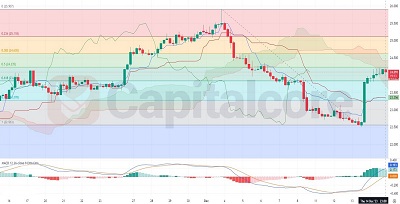
• Chart time-zone is UTC (+03:00)
• Candles’ time-frame is 4h.
The H4 chart for silver indicates a recent recovery from a significant downtrend, as prices have pushed above the Ichimoku cloud, suggesting a shift towards bullish sentiment. The Fibonacci retracement levels drawn from the high to the low points highlight a rebound, with price currently testing the 0.236 level as potential resistance. The MACD indicator shows a bullish crossover and divergence from the signal line, supporting the upward price momentum. However, the market has yet to confirm a sustainable reversal, as prices remain below key resistance levels.
• DISCLAIMER: Please note that the above analysis is not an investment suggestion by “Capitalcore Ltd”. This post has been published only for educational purposes.