- December 28, 2023
- Posted by: capadmin
- Category: Market News
Initial Consolidation Phase and Indicators
The chart shows the XAG/USD (Silver/US Dollar) exchange rate’s performance over a period of time. Notably, the price recently encountered resistance near the 24.50 level, suggesting a pause in the bullish momentum of silver against the US Dollar. The upper green-shaded area may represent a potential supply zone where sellers are likely to enter the market, possibly driving a reversal or price correction.
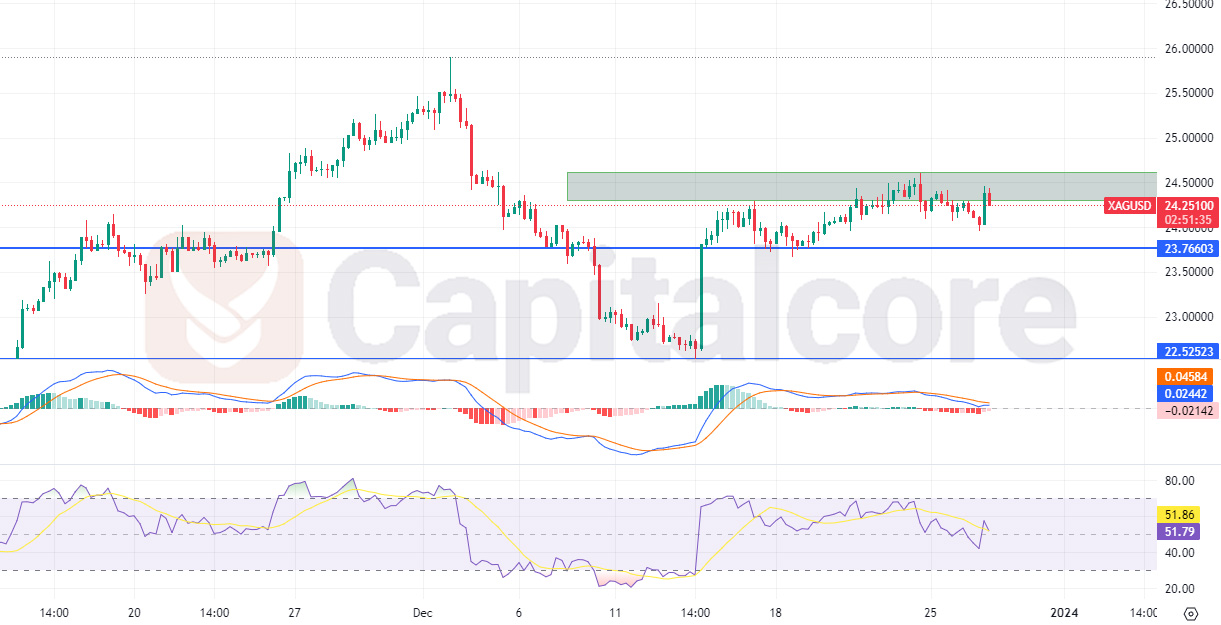
Chart Notes:
• Chart time-zone is UTC (+03:00)
• Candles’ time-frame is 4h.
In the earlier part of the chart, we observe a consolidation pattern in the silver price, indicated by small, alternating bullish and bearish candlesticks. This horizontal channel reflects market indecision, with an equilibrium between buyers and sellers. However, the chart then depicts a breakdown below the support level around 23.50, which could be due to factors like a strong US Dollar, changes in industrial demand for silver, or shifts in investor sentiment towards safe-haven assets.
Progressing through the chart, the price of silver experiences a recovery, forming a series of higher highs and higher lows. This bullish sequence is marked by larger green candlesticks, suggesting a renewed buying interest. This rally could have been influenced by a variety of factors, including a weaker US Dollar, increased industrial demand, or market speculation. Focusing on the indicators, the Moving Average Convergence Divergence (MACD) shows a recent bearish crossover with the signal line above the MACD line, hinting at a potential slowdown in the upward momentum or a forthcoming bearish phase.
The Relative Strength Index (RSI) is hovering around the mid-50s, which indicates neither overbought nor oversold conditions. However, it’s leaning towards the upper half of the range, suggesting a stronger bullish sentiment in the market, but still with room for upward movement before being considered overbought. Technical patterns and indicators are essential, but they are part of a broader narrative that includes fundamental factors. For silver, industrial demand, inflation expectations, and US Dollar dynamics are crucial. The Federal Reserve’s monetary policy, global economic health, and geopolitical events can also significantly influence silver prices.
In conclusion, while the recent price action suggests bullish sentiment, the indicators caution of potential changes ahead. A comprehensive analysis would incorporate upcoming economic data, central bank announcements, and geopolitical developments, in conjunction with the technical analysis, to better understand the market dynamics and future direction of the XAG/USD rate.
• DISCLAIMER: Please note that the above analysis is not an investment suggestion by “Capitalcore Ltd”. This post has been published only for educational purposes.