- January 5, 2024
- Posted by: capadmin
- Category: Market News
Silver Buyers Challenge Downtrend at Fibonacci Line
Silver’s price movements can be influenced by a variety of factors, ranging from industrial demand to investment appetite, often making its market particularly interesting for technical analysis. By examining the latest chart patterns and technical indicators, traders aim to forecast future movements. The following analysis provides insights into silver’s current trends and potential directional cues.

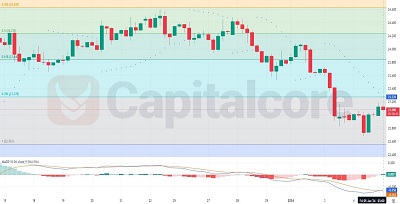
Chart Notes:
• Chart time-zone is UTC (+03:00)
• Candles’ time-frame is 4h.
The technical chart for silver exhibits a rebound off the 0.786 Fibonacci retracement level at $23.278, signaling a possible short-term reversal from the recent downtrend. The appearance of a bullish candle following a doji indicates a struggle for directional dominance but suggests that buyers are temporarily in control. The MACD shows a narrowing gap between the MACD line and the signal line, hinting at a potential bullish crossover; however, caution is warranted as the histogram remains in negative territory. Traders should monitor for a confirmed crossover which could strengthen the bullish case. The 9 EMA still trails below the price action, pointing to resistance ahead. For confirmation of a sustained uptrend, silver prices need to breach the 0.618 Fibonacci level at $23.84. Until then, the market may remain in a state of flux, with the possibility of consolidation.
• DISCLAIMER: Please note that the above analysis is not an investment suggestion by “Capitalcore Ltd”. This post has been published only for educational purposes.