- March 7, 2024
- Posted by: capadmin
- Category: Market News
Silver Uptrend: Parabolic SAR and MACD
The H4 chart for silver shows a recent uptrend, as indicated by the Parabolic SAR with the last two dots positioned below the price candles. This positioning suggests that the trend is bullish in the short term, and traders might consider this a signal to maintain or open long positions. Consistent upward movement in price with the Parabolic SAR beneath is typically seen as a confirmation of continued bullish momentum.
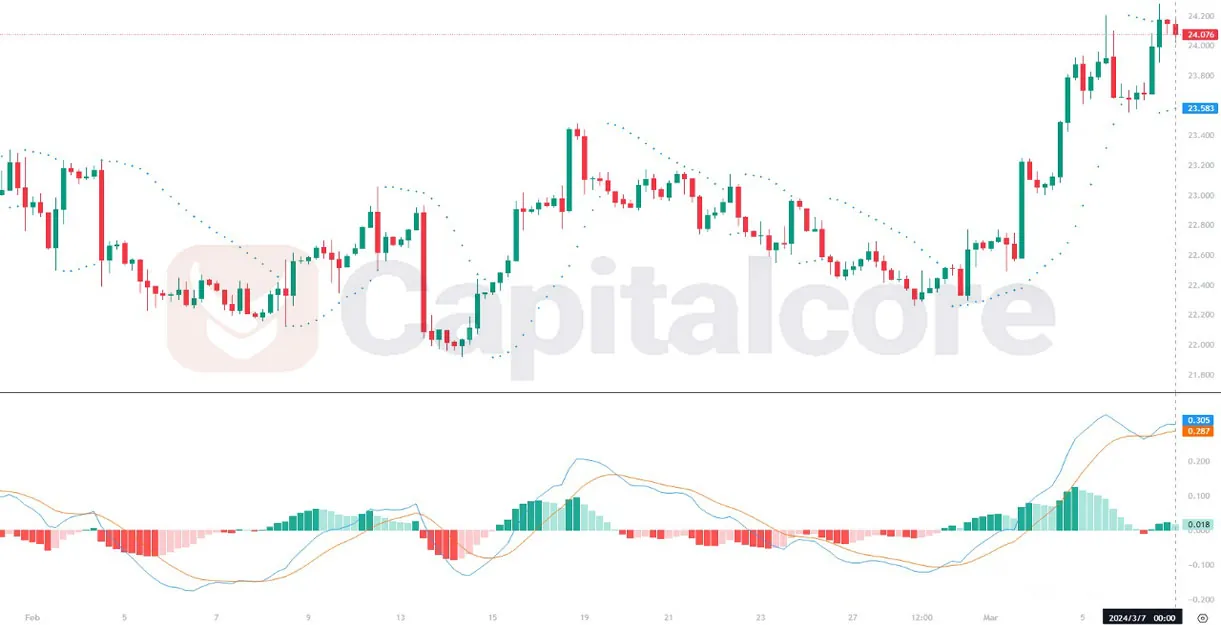
Chart Notes:
• Chart time-zone is UTC (+03:00)
• Candles’ time-frame is 4h.
The MACD (Moving Average Convergence Divergence) provides a more nuanced view of the market’s momentum and potential reversals. In the current context, the MACD histogram demonstrates growing bullish momentum, with the bars increasing in height and staying above the zero line. This is further confirmed by the MACD line (blue) trending upwards away from the signal line (orange), indicating strong buying pressure. However, traders should be cautious of potential overextension if the price deviates too far from the Parabolic SAR, which might lead to a reversal. Therefore, while current indicators are bullish, it is essential to watch for any signs of the MACD leveling off or the Parabolic SAR dots flipping above the price, which could signal a weakening in the uptrend and warrant a reassessment of positions.
• DISCLAIMER: Please note that the above analysis is not an investment suggestion by “Capitalcore Ltd”. This post has been published only for educational purposes.