- September 4, 2023
- Posted by: capadmin
- Category: Market News
Silver’s SMA and RSI: What’s Next?
In the constantly fluctuating world of commodities, Silver’s 4-hour chart offers an insightful window into its current momentum. With key indicators like the SMA and RSI painting a specific picture, our analysis aims to provide traders with a deeper understanding of where Silver might be heading next. Dive into the specifics below to harness this precious metal’s potential.

Chart Notes:
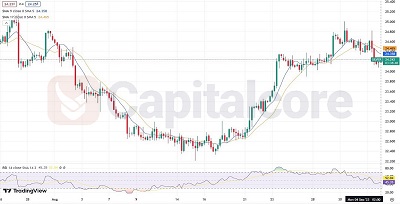
• Chart time-zone is UTC (+03:00)
• Candles’ time-frame is 4h.
Based on the 4-hour time frame for Silver, there’s a bearish indication as the Short SMA has recently crossed below the Long SMA, signaling potential downside momentum. The RSI, currently at 45.35, is approaching the oversold territory but is not there yet. However, it’s worth noting the divergence between the RSI and its RSI-Based MA, which stands at 52.04. This divergence might indicate a weakening bearish momentum in the near term. Traders should be cautious and monitor other confirming signals or wait for the RSI to breach the 30 level, which would indicate a stronger oversold condition, before making any decisions. Always pair technical insights with fundamental analysis and current market conditions.
• DISCLAIMER: Please note that the above analysis is not an investment suggestion by “Capitalcore Ltd”. This post has been published only for educational purposes.