- March 12, 2024
- Posted by: capadmin
- Category: Market News
Silver Streak: Climbing the Chart
In the shimmering world of precious metals, silver often plays a dual role, balancing its place between industrial demand and investment allure. Its price dynamics not only reflect investor sentiment but also the realities of industrial consumption and production.

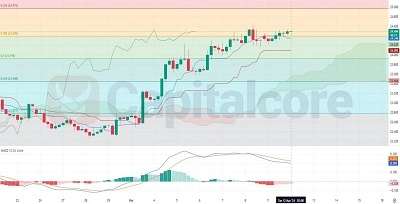
Chart Notes:
• Chart time-zone is UTC (+03:00)
• Candles’ time-frame is 4h.
The silver market is exhibiting bullish momentum, as observed in the 4-hour timeframe, with prices consistently trading above the Ichimoku cloud, indicating a strong uptrend. The MACD remains in positive territory, although the histogram shows a slight decrease in momentum as the bars shorten. The Fibonacci retracement levels from recent highs and lows suggest potential support and resistance zones; notably, prices are testing the 0.236 retracement level, which could act as immediate resistance. Should a pullback occur, the 0.5 and 0.618 levels are likely to provide significant support. The Bollinger Bands are widening, suggesting increased market volatility, with the price trading near the upper band, signaling continued bullish sentiment
• DISCLAIMER: Please note that the above analysis is not an investment suggestion by “Capitalcore Ltd”. This post has been published only for educational purposes.