- March 28, 2024
- Posted by: capadmin
- Category: Market News
Precious Metals: Silver’s Consolidation Zone
Silver is a precious metal that serves both as an investment and an industrial component. Its price is influenced by a variety of factors, ranging from economic indicators to market sentiment. As traders and investors analyze the silver market, technical indicators provide insights into potential price movements and trends.

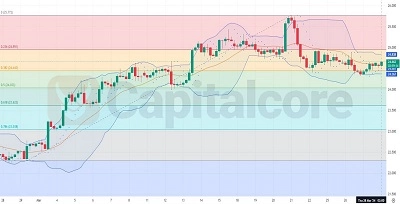
Chart Notes:
• Chart time-zone is UTC (+03:00)
• Candles’ time-frame is 4h.
The H4 chart for silver shows a period of consolidation after a significant uptrend. The price is hovering above the 0.618 Fibonacci retracement level of the recent swing, indicating potential support at this key level. The Bollinger Bands have narrowed, suggesting decreased volatility and a potential build-up for a breakout. Significantly, the Parabolic SAR’s last dots are below the candles, hinting at a possible bullish undertone. However, the market has not yet shown a decisive move away from the current consolidation zone. Traders might anticipate a potential bullish signal if the price breaks above the upper Bollinger Band, or a bearish signal if it falls below the 0.618 Fibonacci level.
• DISCLAIMER: Please note that the above analysis is not an investment suggestion by “Capitalcore Ltd”. This post has been published only for educational purposes.