- November 22, 2023
- Posted by: capadmin
- Category: Market News
Dow Jones Analytical Forecast Snapshot
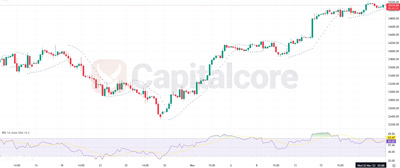
The US30 shows a bullish trend, as evidenced by the ascending candlestick pattern. The Parabolic SAR dots are below the price bars, confirming upward momentum. However, the proximity of the dots to the candlesticks suggests a potential trend reversal may be near. Traders typically view such positioning as a sign to monitor for sell signals or tighten stop-loss orders. The RSI, lingering around the 60 mark, indicates strong buying pressure without being overbought. The index has not hit the overbought threshold of 70, allowing room for potential upward movement before expecting a pullback.

Chart Notes:
• Chart time-zone is UTC (+03:00)
• Candles’ time-frame is 4h.
A more detailed look at the US30 chart reveals that the bullish movement has been steady, with normal retracements, indicating healthy uptrends. The RSI shows a slight divergence, as it has not reached new highs with the price, which can be a subtle sign of weakening momentum. This divergence doesn’t confirm a reversal but warrants cautious observation for any further signs of trend fatigue. The recent candles have smaller bodies, suggesting a decrease in buying enthusiasm. If the Parabolic SAR dots flip to the top of the price, it could signal a short-term downtrend. For now, the medium-term outlook remains bullish, supported by the sustained RSI level above 50 and the absence of any bearish candlestick patterns, such as a shooting star or bearish engulfing formation, which would indicate a strong reversal signal.
• DISCLAIMER: Please note that the above analysis is not an investment suggestion by “Capitalcore Ltd”. This post has been published only for educational purposes.