- November 9, 2023
- Posted by: capadmin
- Category: Market News

Decoding DJIA: Signals from Bollinger and RSI
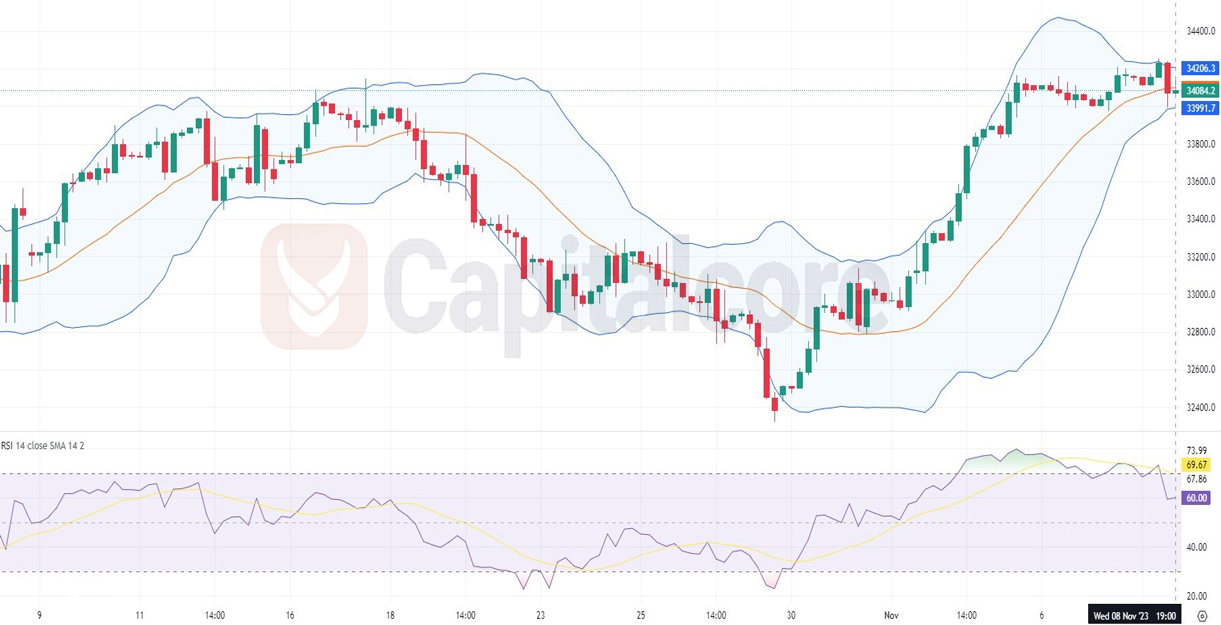
The US30, also known as the Dow Jones Industrial Average (DJIA), is depicted in the 4-hour (H4) chart, showcasing recent price action and volatility. This technical analysis will delve into the key patterns and indicators, including the Bollinger Bands, moving averages, and the Relative Strength Index (RSI), to discern potential future movements.

Chart Notes:
• Chart time-zone is UTC (+03:00)
• Candles’ time-frame is 4h.
Examining the US30 on the H4 chart, we observe a recent uptrend as the price has consistently been making higher highs and higher lows. The market has bounced off the lower Bollinger Band, suggesting a strong support level, and has risen above the 20-period moving average, which may act as a dynamic support in the near term. The 50-period moving average also appears to be sloping upwards, reinforcing the bullish sentiment. Currently, the price is testing the upper Bollinger Band, which could act as a resistance zone. The RSI is just below the overbought threshold of 70, indicating strong buying momentum but also warning of potential pullbacks if it crosses into overbought territory. Traders may look for the RSI to remain above the midline (50) to maintain a bullish outlook. If the price remains above the 34084.2 level, we could see continued bullish momentum. Conversely, a break below could signal a shift in trend.
• DISCLAIMER: Please note that the above analysis is not an investment suggestion by “Capitalcore Ltd”. This post has been published only for educational purposes.