- April 25, 2024
- Posted by: capadmin
- Category: Market News
Navigating US500’s Cloudy Forecast
The US500 index presents a nuanced technical landscape in its latest H4 chart. Amidst fluctuating market sentiments, the Ichimoku Cloud and MACD indicators offer critical insights into potential trends and reversals, guiding traders through the intricacies of market movements.
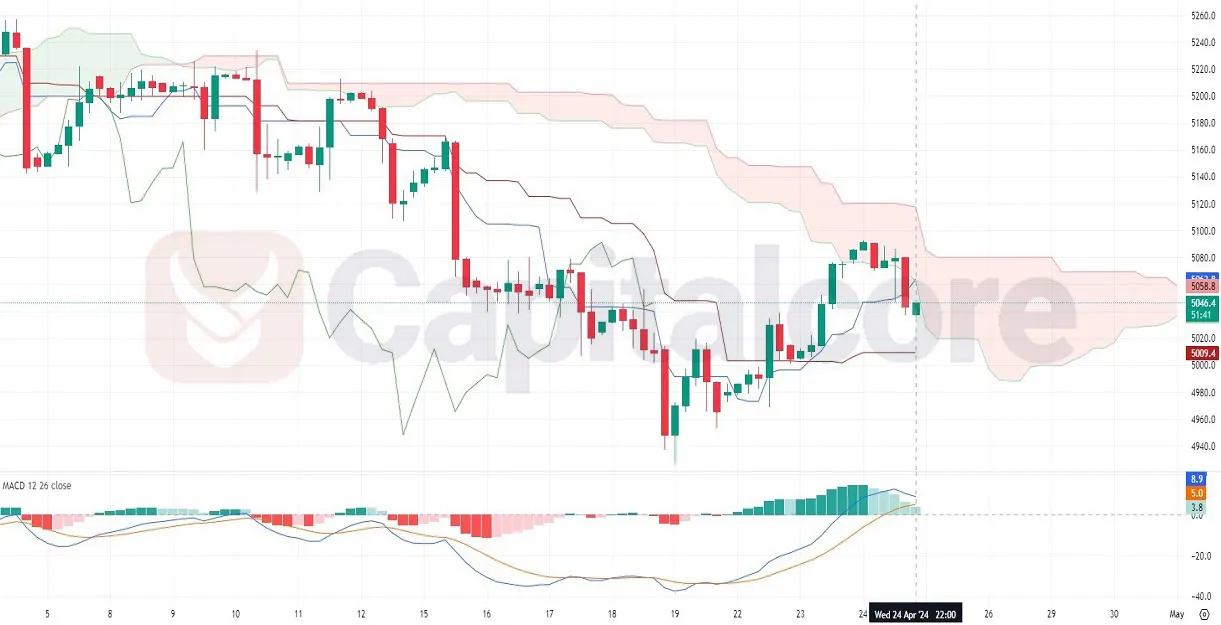
Chart Notes:
• Chart time-zone is UTC (+03:00)
• Candles’ time-frame is 4h.
Examining the H4 chart for the US500, we observe that the price has recently entered the Ichimoku Cloud, signaling a potential trend change. The transition into the cloud suggests indecision, with the possibility of either a bullish breakout or a bearish pullback. The bullish candles preceding the current price position within the cloud indicate some buying pressure; however, the resistance at the upper boundary of the cloud may pose a challenge. The MACD indicator reinforces this ambiguity, showing a recent bullish crossover as the MACD line (blue) crosses above the signal line (orange), and the histogram reflects growing bullish momentum. Despite this, traders should exercise caution as the price navigates within the cloud, keeping an eye on the MACD for confirmation of either continuation or reversal.
• DISCLAIMER: Please note that the above analysis is not an investment suggestion by “Capitalcore Ltd”. This post has been published only for educational purposes.