- May 24, 2024
- Posted by: capadmin
- Category: Market News
MACD Shows Bullish Momentum for USDCHF
The USD/CHF currency pair, reflecting the exchange rate between the United States Dollar (USD) and the Swiss Franc (CHF), is a crucial indicator of global market sentiment. The Swiss Franc, often a safe-haven currency, typically appreciates during market instability, while the USD is influenced by robust economic data and Federal Reserve policies. Today, SNB Chairman Thomas Jordan’s speech is highly anticipated, with a more hawkish tone potentially strengthening the CHF currency price. Concurrently, the US will release key reports, including Core Durable Goods Orders (forecasted at 0.1%) and Durable Goods Orders (forecasted at -0.9%), which will provide insights into the US manufacturing sector’s health. Stronger-than-expected data could boost the USD. Additionally, speeches from FOMC Member Waller and the Revised University of Michigan (UoM) Consumer Sentiment (forecasted at 67.8) are critical, as high consumer confidence and inflation expectations can influence future Fed policies. These factors collectively shape the USD/CHF pair’s movements, highlighting the importance of central bank communications and economic indicators in forex trading.
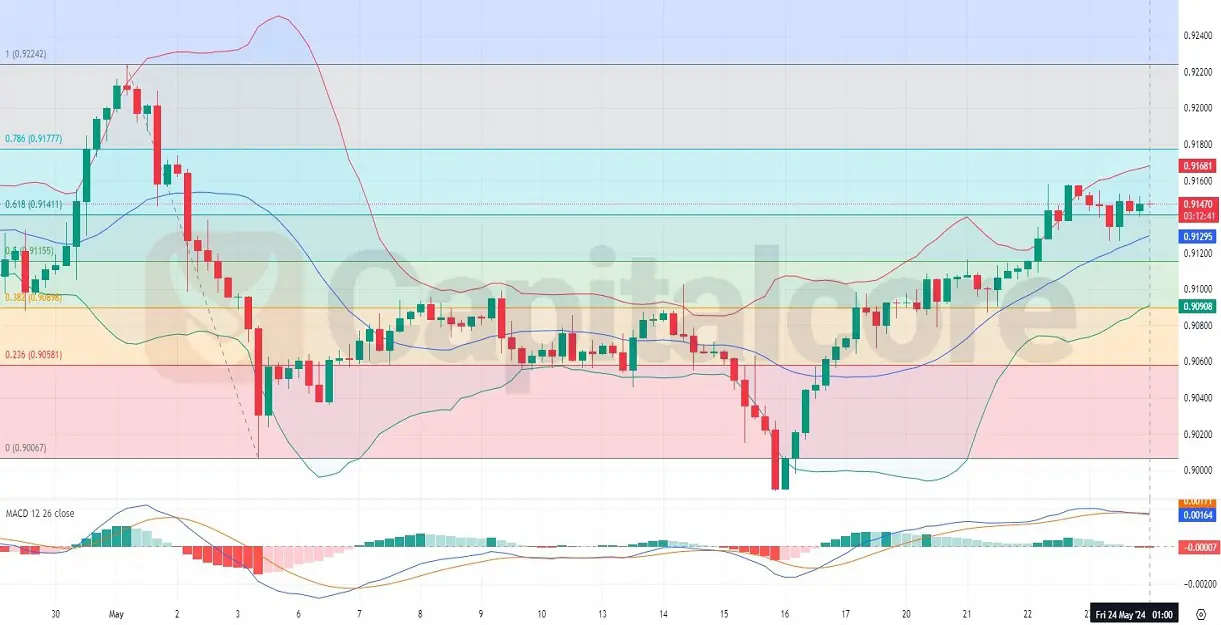
Chart Notes:
• Chart time-zone is UTC (+03:00)
• Candles’ time-frame is 4h.
The H4 chart of the USD/CHF pair reveals several significant technical indicators and patterns, highlighting key support and resistance levels through well-defined Fibonacci retracement levels. Currently, the USD-CHF pair is trading around the 0.91470 level, situated between the 0.618 (0.91411) and 0.786 (0.91777) Fibonacci levels, indicating a crucial resistance area near 0.91681 where the price has repeatedly struggled to break higher. Bollinger Bands display a squeeze pattern, suggesting consolidation with potential for a breakout, as the price hovers near the upper band, indicating upward pressure but also warning of increased volatility with widening bands. The MACD (Moving Average Convergence Divergence) indicator supports a bullish outlook with a bullish crossover for USDCHF, where the MACD line is above the signal line; however, the histogram’s diminishing bullish momentum advises caution. Key support levels to monitor include 0.91295 (the 50% Fibonacci level) and 0.90581 (the 23.6% Fibonacci level), while resistance levels to watch are 0.91777 (the 78.6% Fibonacci level) and 0.92242 (the 100% Fibonacci level).
• DISCLAIMER: Please note that the above analysis is not an investment suggestion by “Capitalcore Ltd”. This post has been published only for educational purposes.