- May 6, 2024
- Posted by: capadmin
- Category: Market News
USD/CHF Technical Analysis and Predictions
The USD/CHF currency pair has seen a marked downtrend, highlighted by the recent swift decline against the Swiss Franc, reflecting broader market dynamics and investor sentiment. This analysis will utilize key technical indicators and chart patterns to understand the recent movements of USD/CHF and anticipate possible future directions.
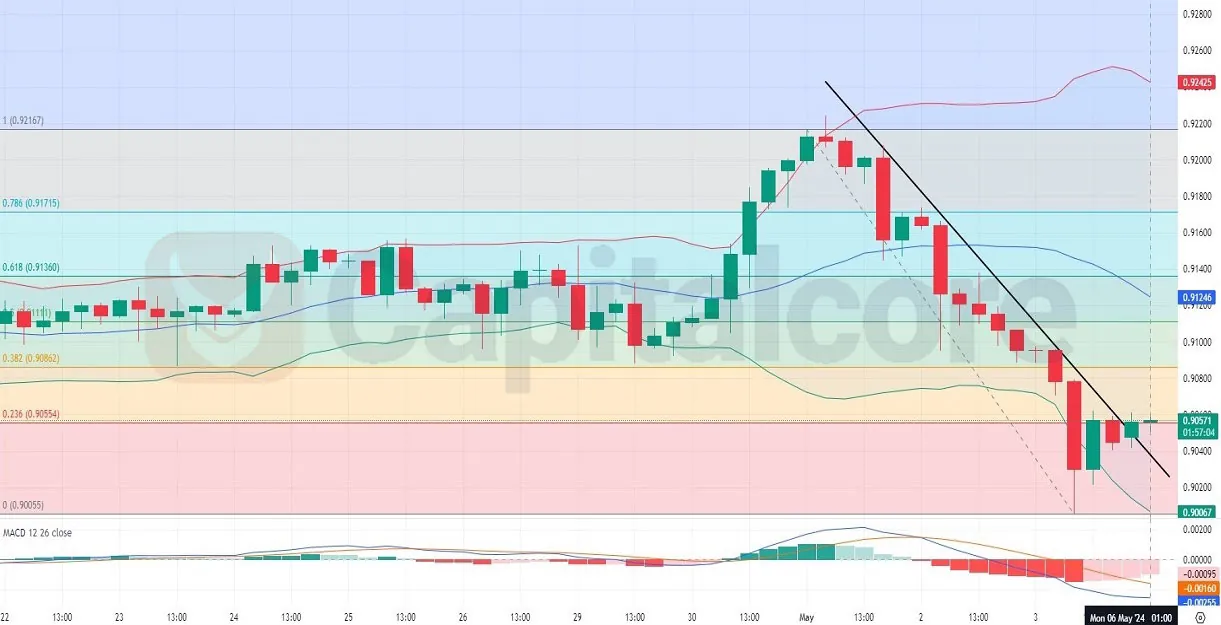
Chart Notes:
• Chart time-zone is UTC (+03:00)
• Candles’ time-frame is 4h.
The USD/CHF pair exhibits a significant downtrend, characterized by a sequence of lower highs and lower lows, indicating sustained bearish momentum. The latest price action challenges a descending trendline, hinting at a potential short-term reversal. Fibonacci retracement levels identify 0.9082 and 0.9136 as critical resistance points for any upward movement. Concurrently, the proximity of the price to the lower Bollinger Band suggests the pair might be oversold, raising the possibility of a rebound. The MACD supports this bearish view, with the MACD line below the signal line, although a reducing negative histogram suggests weakening downward momentum. Overall, the analysis points to a pivotal moment for USD/CHF, with a possible reversal on the horizon if resistance levels are breached, although the prevailing trend remains bearish.
• DISCLAIMER: Please note that the above analysis is not an investment suggestion by “Capitalcore Ltd”. This post has been published only for educational purposes.