- April 2, 2024
- Posted by: capadmin
- Category: Market News
USD/JPY: Consolidation Alert!
The USD/JPY currency pair’s chart exhibits periods where the Bollinger Bands expand, suggesting increased market volatility and significant price movements. For instance, when the bands widen after a period of contraction, it typically precedes a strong trend; this can be seen in the recent sharp rise and fall of prices. Conversely, the bands are currently contracting, which could indicate that the market is entering a consolidation phase. This tightening of bands may precede a breakout, and traders often watch for a close outside the bands as an early sign of a new directional trend.
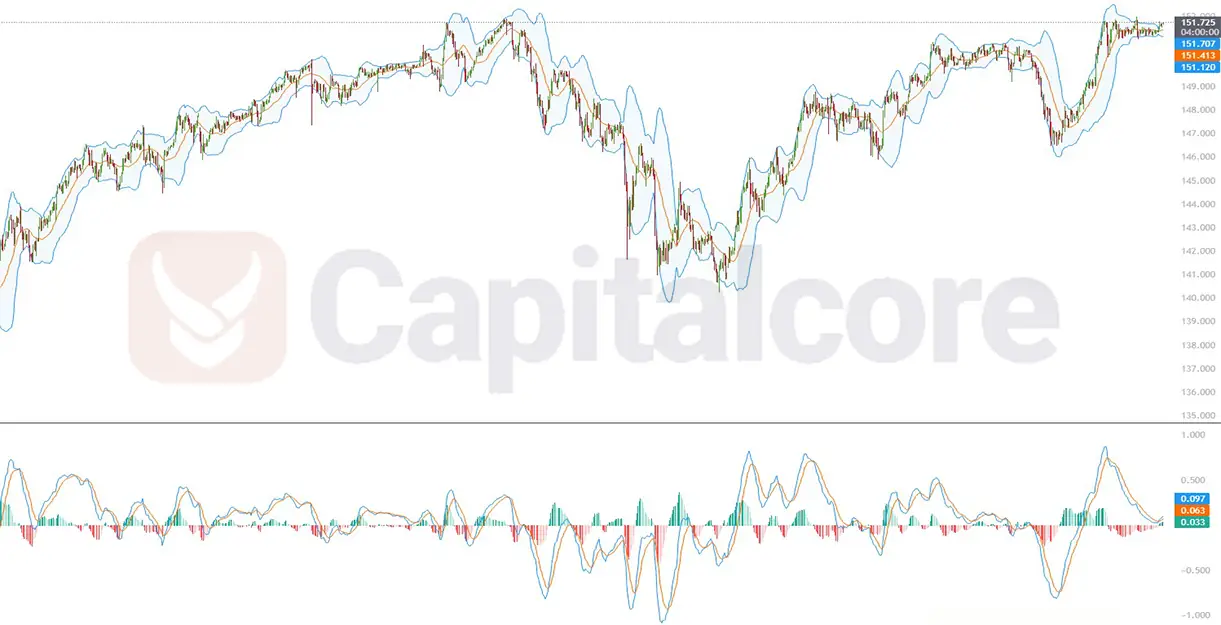
Chart Notes:
• Chart time-zone is UTC (+03:00)
• Candles’ time-frame is 4h.
The MACD indicator below the price chart presents the difference between a fast and slow moving average, alongside a signal line, to gauge the momentum and potential direction of the market. When the MACD line crosses above the signal line, it is often interpreted as bullish, and when it crosses below, it is considered bearish. Currently, the MACD line is above the signal line but appears to be converging, hinting at a possible slowdown in bullish momentum. Additionally, the histogram, which measures the distance between the MACD line and the signal line, has seen decreasing bar lengths, supporting the potential for a loss of momentum or a forthcoming reversal.
• DISCLAIMER: Please note that the above analysis is not an investment suggestion by “Capitalcore Ltd”. This post has been published only for educational purposes.