- November 27, 2023
- Posted by: capadmin
- Category: Market News
Analyzing USD/JPY’s Subtle Bearish Cues
The USD/JPY currency pair is a widely watched indicator of relative strength between the U.S. dollar and the Japanese yen, offering insights into investor sentiment and international economic health.
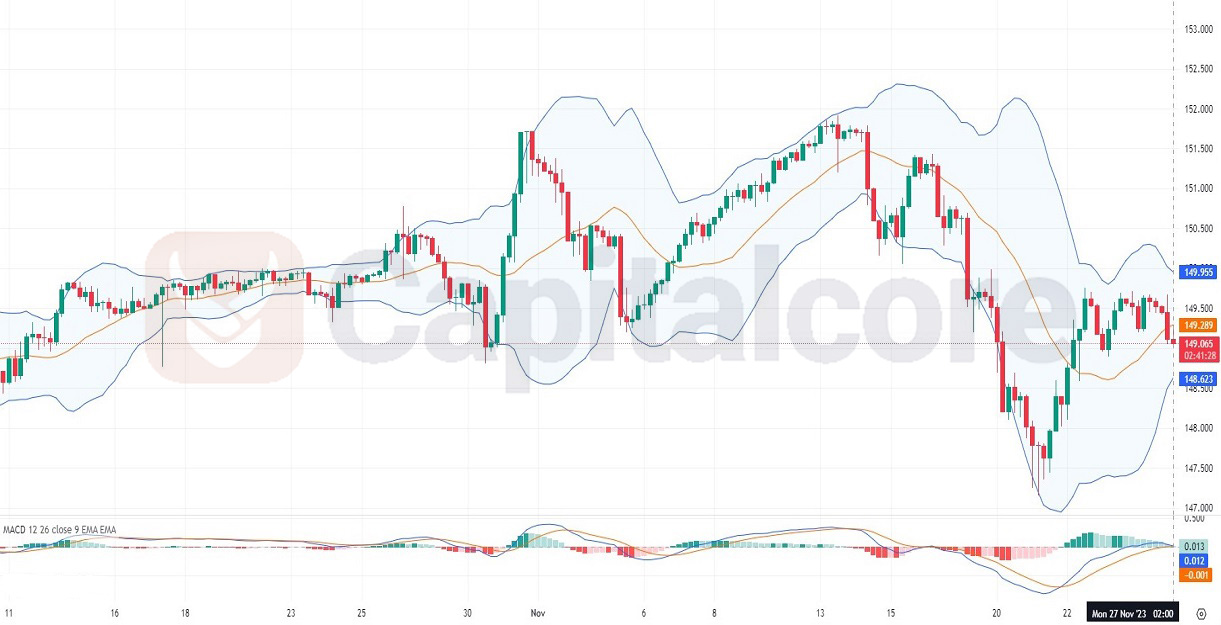
Chart Notes:
• Chart time-zone is UTC (+03:00)
• Candles’ time-frame is 4h.
The USD/JPY has shown some volatility within the Bollinger Bands, with recent price action hovering around the middle band, indicating a potential consolidation phase. The Moving Average Convergence Divergence (MACD) histogram is displaying a slight bearish momentum as the MACD line is under the signal line, though the decline in bearish bars suggests that downward momentum is waning. As of the latest candlestick on the 4-hour chart, prices have dipped slightly below the 150.00 psychological level, which could act as a pivot point for the pair’s next move. The upper and lower bands of the Bollinger Bands are neither contracting nor expanding significantly, suggesting that the market is in a state of equilibrium without a clear directional trend. Traders might look for a break above the middle Bollinger Band as a sign of bullish momentum or a drop below it for further bearish confirmation.
• DISCLAIMER: Please note that the above analysis is not an investment suggestion by “Capitalcore Ltd”. This post has been published only for educational purposes.