- October 10, 2023
- Posted by: capadmin
- Category: Market News
Bearish Trend Strengthens: Technicals
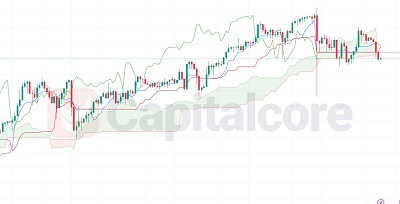
In the 4-hour USD/JPY chart, the most recent Ichimoku Cloud is painted in green, with the candles comfortably nestled within it. This configuration typically indicates a range-bound market, suggesting that traders might encounter sideways price movements. However, it’s crucial to exercise patience and closely monitor other technical indicators for confirmation.
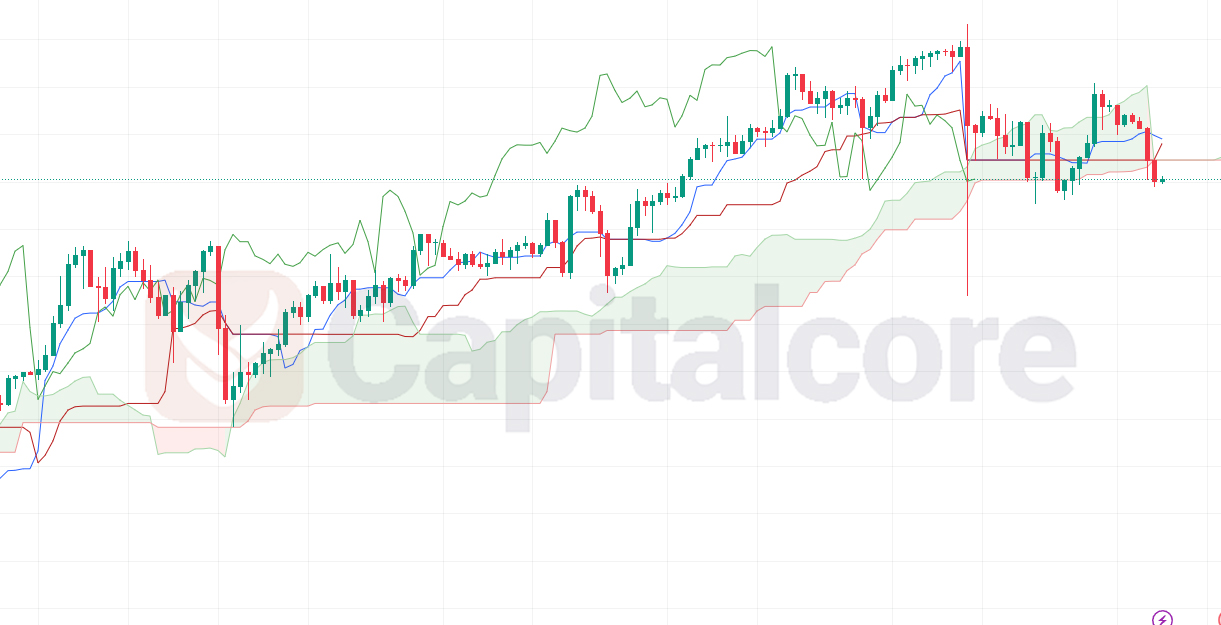
Chart Notes:
• Chart time-zone is UTC (+03:00)
• Candles’ time-frame is 4h.
Furthermore, when examining the MACD (Moving Average Convergence Divergence) oscillator, both the MACD signal line and the MACD line itself are positioned beneath the histogram. This alignment indicates a potential bearish sentiment, implying that traders may anticipate downward price pressure. It’s advisable to keep a watchful eye on these indicators and market developments to make informed trading decisions regarding the USD/JPY currency pair.
• DISCLAIMER: Please note that the above analysis is not an investment suggestion by “Capitalcore Ltd”. This post has been published only for educational purposes.