- May 28, 2024
- Posted by: james w
- Category: Market News
H4 Candlestick Chart Insights
The AUD/USD price chart analysis on the H4 candlestick chart indicates that the price line seems to be ending its bullish phase. After breaking below the Ichimoku cloud, the pair is now testing a significant resistance level at around 0.66600, which aligns with the 0.786 Fibonacci retracement level of the previous bullish wave. This suggests that a bearish wave could be expected soon. The RSI indicator also shows signs of potential bearish divergence, which supports the expectation of a downward movement.
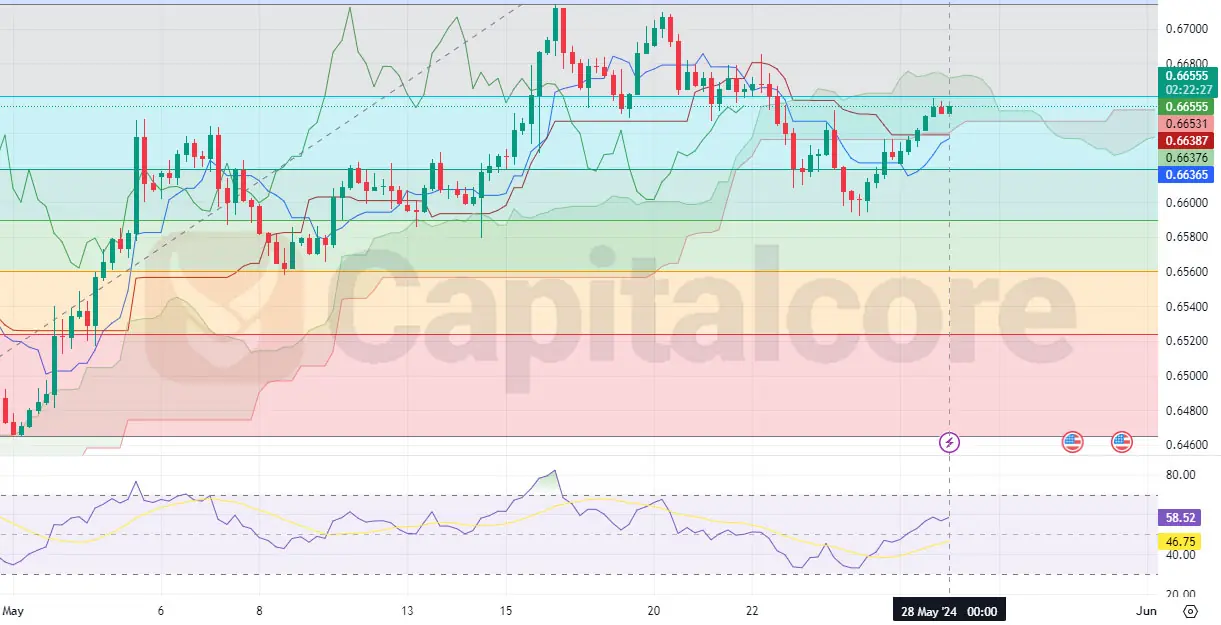
Chart Notes:
• Chart time-zone is UTC (+03:00)
• Candles’ time-frame is 4h.
Looking ahead, important news events could significantly impact the AUD/USD pair. On May 29th, Australia’s CPI y/y is set to be released, with a forecast of 3.4% compared to the previous 3.5%. For the USD, crucial data releases on May 30th include the Prelim GDP q/q with a forecast of 1.3% against the previous 1.6%, and the Unemployment Claims expected to come in at 218K compared to the previous 215K. These economic indicators could provide further volatility to the AUD/USD pair and should be closely monitored for potential impacts on price movements.
• DISCLAIMER: Please note that the above analysis is not an investment suggestion by “Capitalcore Ltd”. This post has been published only for educational purposes.