- July 12, 2023
- Posted by: Lewis Miller
- Category: Market News
Bearish Momentum: CADJPY Shows Downward Trend with Widening Bollinger Bands
CADJPY is currently experiencing a bearish trend, showing signs of downward momentum. With widening Bollinger Bands and the RSI hovering around the 30 level, the pair’s price action indicates increased volatility and potential oversold conditions.
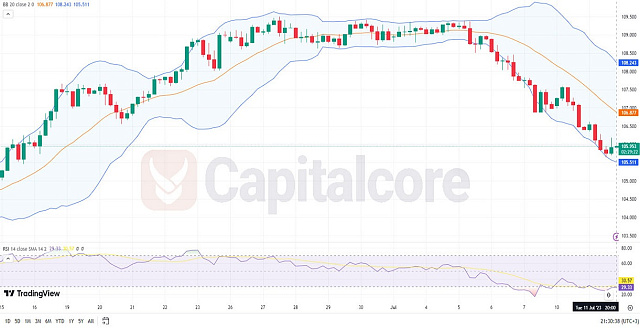
Chart Notes:
• Chart time-zone is UTC (+03:00)
• Candles’ time-frame is 4h.
The CADJPY currency pair is currently exhibiting a bearish trend. The price action suggests a downward bias, as indicated by the widening of the Bollinger Bands, which signifies increased volatility. This expansion in the bands may indicate further downside potential. The RSI hovering around the 30 level suggests the pair is nearing oversold conditions. Traders should exercise caution, as this could imply a potential bounce or reversal. However, it’s essential to consider other technical indicators and fundamental factors to confirm the strength of the trend. Monitoring key support levels and closely watching for any potential bullish signals can provide further insights into the CADJPY’s price movements.
• DISCLAIMER: Please note that the above analysis is not an investment suggestion by “Capitalcore Ltd”. This post has been published only for educational purposes.