- August 29, 2023
- Posted by: capadmin
- Category: Market News

Ichimoku & MACD: Bullish Indications
In the context of the USD/CAD trading pair, the Ichimoku analysis reveals a potentially bullish outlook. The most recent cloud in the Ichimoku indicator is green, which often signifies a positive trend. The candlesticks are positioned above this cloud, suggesting a potential upward bias in the market. Furthermore, both the conversion line and the base line are located beneath the price action, adding to the potential bullish sentiment. This combination of factors could indicate an increasing strength in the USD against the CAD.
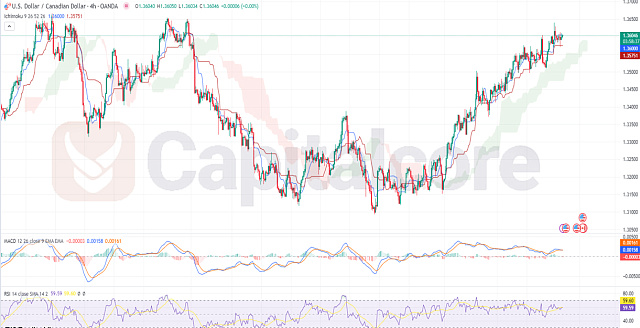
Chart Notes:
• Chart time-zone is UTC (+03:00)
• Candles’ time-frame is 4h.
Moving on to the Relative Strength Index (RSI), the reading stands at 59.50. This value falls within a range that suggests the market is in a balanced state between overbought and oversold conditions. While not indicating extreme momentum in either direction, this RSI level hints at a reasonably stable market sentiment. Shifting focus to the Moving Average Convergence Divergence (MACD) indicator, both the MACD line and the signal line are positioned above the histogram. This configuration often suggests bullish momentum in the market. The MACD lines being above the histogram potentially indicates a growing trend strength, supporting the notion of a positive bias in the USD/CAD pair.
• DISCLAIMER: Please note that the above analysis is not an investment suggestion by “Capitalcore Ltd”. This post has been published only for educational purposes.